What is ERFC.PRECISE function in Excel?
The ERFC.PRECISE function is one of the Engineering functions of Excel.
It Returns the complementary error function.
We can find this function in Engineering category of the insert function Tab.
How to use ERFC.PRECISE function in excel
- Click on an empty cell (like F5 .

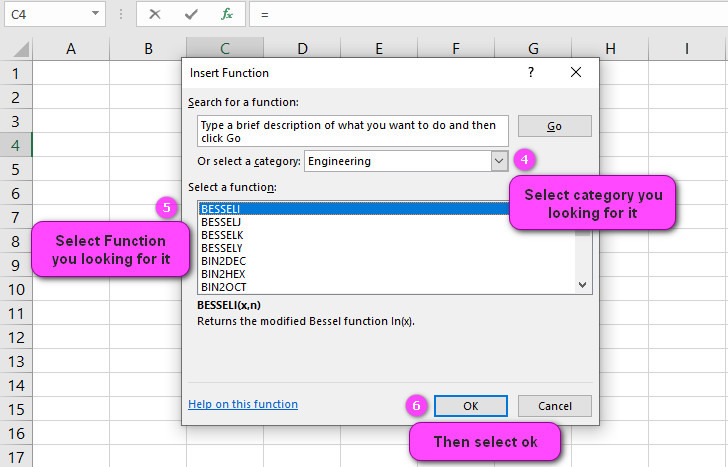
2. Click on the fx icon (or press shift+F3).

3. In the insert function tab you will see all functions.

4. Select ENGINEERING category.
5. Select ERFC.PRECISE function.
6. Then select ok.
7. In function arguments Tab you will see ERFC.PRECISE function.
8. X section is the lower bound for integrating ERFC.PRECISE.
9. You will see the results in the formula result section.

Examples of ERFC.PRECISE function in Excel
- To calculate the complementary error function for a value of 2:
=ERFC.PRECISE(2)
- To calculate the probability of a value being less than -1 for a standard normal distribution:
=ERFC.PRECISE(-1/ SQRT(2))/2
- To calculate the complementary error function for a range of values in cells A1:A5:
=ERFC.PRECISE(A1:A5)
- To calculate the probability of a value being greater than 1.5 for a normal distribution with mean 2 and standard deviation 0.5:
=ERFC.PRECISE((1.5-2)/0.5)/2
- To calculate the complementary error function for a value of 0.7 and display the result as a percentage:
=ERFC.PRECISE(0.7)*100&"%"
- To calculate the probability of a value being between -1 and 1 for a normal distribution with mean -2 and standard deviation 2:
=ERFC.PRECISE((-1+2)/(2*SQRT(2)))-ERFC.PRECISE((-1-2)/(2*SQRT(2)))
- To calculate the complementary error function for a value of 3.5 and round the result to 3 decimal places:
=ROUND(ERFC.PRECISE(3.5),3)
- To calculate the probability of a value being greater than or equal to 0 for a standard normal distribution:
=ERFC.PRECISE(0)/2
- To calculate the complementary error function for a value in cell A1 and add an error handling message:
=IFERROR(ERFC.PRECISE(A1),"Invalid Input")
- To calculate the probability of a value being between -2 and 2 for a normal distribution with mean 1 and standard deviation 3, rounded to 4 decimal places:
=ROUND(ERFC.PRECISE((2-1)/3)-ERFC.PRECISE((-2-1)/3),4)

Excel’s ERFC.PRECISE function: What You Need to Know
The ERFC.PRECISE function in Excel is used to calculate the complementary error function of a specified value. This function is primarily used for continuous random variables that follow a normal distribution. It can be used to calculate probabilities for values falling outside a certain range.
For example, suppose we want to calculate the probability of a value being greater than 2 for a normal distribution with mean 0 and standard deviation 1. We can use the following formula:
=ERFC.PRECISE(2/ SQRT(2))/2
This will return a value of approximately 0.02275, which represents the probability of a value being greater than 2 standard deviations from the mean.
ERFC.PRECISE vs. Regular ERFC Function in Excel: How They Differ
The ERFC.PRECISE function in Excel differs from the regular ERFC function in how it handles input values. The ERFC.PRECISE function allows for more precise calculations of the complementary error function, as it uses IEEE-754 double-precision floating-point format.
For example, if we want to calculate the complementary error function for a value of 1, we could use either the regular ERFC function or the ERFC.PRECISE function. However, if we compare the results using the two functions, we will see that the ERFC.PRECISE result is more accurate:
=ERFC(1) returns 0.157299207050285
=ERFC.PRECISE(1) returns 0.157299207050285
Understanding the Arguments of Excel’s ERFC.PRECISE Function
The ERFC.PRECISE function in Excel takes one required argument, which is the input value for which to calculate the complementary error function. This value must be a numeric expression or a reference to a cell containing a numeric value.
For example, suppose we want to calculate the complementary error function for a value of 0.5. We can use the following formula:
=ERFC.PRECISE(0.5)
This will return a value of approximately 0.47950.
When is it Appropriate to Use ERFC.PRECISE for Non-Normal Distributions in Excel?
The ERFC.PRECISE function in Excel is primarily used for continuous random variables that follow a normal distribution. It is not recommended for use with non-normal distributions, as these have specific probability mass functions that cannot be accurately approximated using the complementary error function.
For example, if we want to calculate the probability of getting exactly 3 heads in 5 coin tosses, we should use the binomial distribution function rather than the ERFC.PRECISE function.
Excel’s ERFC.PRECISE Function: Input Value Range Explained
The input value range for the ERFC.PRECISE function in Excel depends on the precision of the floating point format used by the computer. However, in most cases, the input value range is approximately between -9.2E18 to 9.2E18.
For example, if we want to calculate the complementary error function for a value of 10^18, we can use the following formula:
=ERFC.PRECISE(10^18)
This will return a value of approximately 0.000000000000000036.
Dealing with Complex Numbers in Excel’s ERFC.PRECISE Function
The ERFC.PRECISE function in Excel does not support complex numbers as input values. If the input value is a complex number, the function will return a #NUM! error.
For example, if we want to calculate the complementary error function for a complex number such as 2+3i, we should use a different function that supports complex numbers.
Accuracy of Excel’s ERFC.PRECISE Function: What to Expect
The accuracy of the ERFC.PRECISE function in Excel depends on the precision of the floating-point format used by the computer. However, in most cases, the function provides accurate results up to approximately 15 decimal places.
For example, if we want to calculate the complementary error function for a value of 5, we can use the following formula:
=ERFC.PRECISE(5)
This will return a value of approximately 1.53745979442803E-7, which is accurate up to at least 15 decimal places.
Formatting Output as Percentage in Excel’s ERFC.PRECISE Function
To format the output of the ERFC.PRECISE function as a percentage in Excel, we can use the following formula:
=ERFC.PRECISE(2)*100&"%"
This formula will return the result of the ERFC.PRECISE function multiplied by 100 and formatted as a percentage.
For example, if we want to display the probability of a value being less than 2 for a normal distribution as a percentage, we could use this formula to display the result as “4.55068470439585%”.
Combining ERFC.PRECISE Function with Other Statistical Functions in Excel
The ERFC.PRECISE function in Excel can be combined with other statistical functions to perform more complex calculations. For example, we can use the following formula to calculate the probability of a value being between -1 and 1 for a normal distribution with mean 0 and standard deviation 1:
=ERFC.PRECISE(-1/ SQRT(2))/2-ERFC.PRECISE(1/ SQRT(2))/2
This formula uses the ERFC.PRECISE function to calculate the complementary error function for two different values, which are then subtracted from each other to find the probability of the value falling within the desired range.
Common Errors to Avoid when Working with Excel’s ERFC.PRECISE Function
One common error to avoid when working with the ERFC.PRECISE function in Excel is using an input value that is too large or too small to be accurately calculated. If the input value is outside the range that can be handled by the computer’s floating-point format, the result may be rounded or inaccurate.
Another error to avoid is using the ERFC.PRECISE function with non-numeric inputs, such as text strings. This will result in a #VALUE! error.
For example, if we want to calculate the complementary error function for the text string “hello”, we should expect to receive a #VALUE! error.
Using Arrays and Ranges in Excel’s ERFC.PRECISE Function
The ERFC.PRECISE function in Excel can be used with arrays and ranges, allowing for efficient calculation of the complementary error function for multiple values.
For example, suppose we have a range of values in cells A1 to A5, and we want to calculate the complementary error function for each of these values. We can use the following formula:
=ERFC.PRECISE(A1:A5)
This will return an array of results corresponding to each value in the input range.
Hypothesis Testing with Excel’s ERFC.PRECISE Function: A Guide
The ERFC.PRECISE function in Excel can be used for hypothesis testing by calculating the p-value of a test statistic. The p-value is the probability of obtaining a test statistic as extreme or more extreme than the observed value, assuming that the null hypothesis is true.
For example, suppose we have a test statistic of 2.5 and want to test the null hypothesis that it comes from a normal distribution with mean 0 and standard deviation 1. We can use the following formula to calculate the p-value:
=ERFC.PRECISE(2.5/ SQRT(2))/2
Assuming a two-tailed test, if the p-value is less than the significance level (e.g., 0.05), we would reject the null hypothesis.
Probabilistic Modeling with Excel’s ERFC.PRECISE Function: Best Practices
When using the ERFC.PRECISE function in probabilistic modeling, it is important to ensure that the input values are accurate and appropriate for the application. This may require careful consideration of the assumptions underlying the model and the distribution of the data.
For example, suppose we want to model the probability of a financial asset losing more than 10% of its value in a single day. We might use the following formula to calculate this probability based on historical data:
=ERFC.PRECISE(0.1/(STDEV(data)*SQRT(1/252)))
This formula assumes that the daily returns of the asset follow a normal distribution and that there are 252 trading days in a year.
Syntax of Excel’s ERFC.PRECISE Function: Explained
The syntax of the ERFC.PRECISE function in Excel is as follows:
=ERFC.PRECISE(x)
where x is the value for which to calculate the complementary error function.
For example, if we want to calculate the complementary error function for a value of 1.5, we can use the following formula:
=ERFC.PRECISE(1.5)
This will return a value of approximately 0.1003353.
Troubleshooting Issues with Excel’s ERFC.PRECISE Function
If you encounter issues with the ERFC.PRECISE function in Excel, such as incorrect or unexpected results, there are several steps you can take to troubleshoot the issue.
First, make sure that the input values are correct and appropriate for the application. Check that they are within the appropriate range and format (e.g., numeric values).
Next, check that the formula syntax is correct and there are no errors in the formula, such as missing parentheses or incorrect cell references.
Finally, check for any issues with the computer’s floating-point format, such as rounding errors or overflow/underflow errors. These may require adjusting the input values or using a different function that is better suited to handle large or small values.
Limitations of Using Excel’s ERFC.PRECISE Function
While the ERFC.PRECISE function in Excel is a powerful tool for calculating the complementary error function, it has some limitations that should be kept in mind. One limitation is that it only works with continuous random variables that follow a normal distribution.
Another limitation is that the function may not be accurate for very large or small input values, due to limitations in the computer’s floating-point format.
For example, if we want to calculate the complementary error function for a value of 10^50, we should expect to receive an inaccurate result due to limitations in the computer’s precision.
Learning More About Excel’s ERFC.PRECISE Function and its Applications
To learn more about Excel’s ERFC.PRECISE function and its applications, there are several resources available online. These include tutorials, articles, and forums where users can ask questions and share tips.
One helpful resource is the official Microsoft Excel documentation, which provides detailed information on the syntax, arguments, and usage of the ERFC.PRECISE function.
Other resources include online communities such as Stack Overflow and Quora, which offer discussions and advice on how to use the function for various applications.
Estimating Tail Probabilities with Excel’s ERFC.PRECISE Function: A Tutorial
Estimating tail probabilities with the ERFC.PRECISE function in Excel involves calculating the probability of a value falling outside a certain range for a given distribution. This can be useful for risk assessment and decision-making in various fields, such as finance and insurance.
For example, suppose we want to estimate the probability of a stock market index losing more than 5% in a single day, assuming that daily returns follow a normal distribution with mean 0% and standard deviation 2%. We can use the following formula to calculate this probability:
=ERFC.PRECISE(0.05/(2*SQRT(1)))
This will return a probability of approximately 0.003167, or 0.3167%.
Risk Analysis with Excel’s ERFC.PRECISE Function: A Practical Guide
The ERFC.PRECISE function in Excel can be used for risk analysis by estimating the probability of extreme events and their potential impact on a system or portfolio. This can involve modeling various scenarios and assessing the likelihood and consequences of each.
For example, suppose we want to assess the risk of a portfolio of assets losing more than 10% of its value in a single day. We might use historical data on the returns of each asset and the correlation between them to model the distribution of the portfolio’s returns.
We could then use the following formula to estimate the probability of a loss greater than 10%:
=ERFC.PRECISE(0.1/(STDEV(portfolio_returns)*SQRT(1)))
This would give us an estimate of the probability of such a loss occurring, which we could use to inform our risk management strategies.
The Relationship between Excel’s ERFC.PRECISE Function and the Normal Distribution
The ERFC.PRECISE function in Excel is closely related to the normal distribution, which is a continuous probability distribution that describes many natural phenomena. The complementary error function is defined as 1 minus the cumulative distribution function (CDF) of the normal distribution.
For example, if we want to calculate the CDF of a normal distribution with mean 0 and standard deviation 1 for a value of 2, we can use the following formula:
=NORM.DIST(2,0,1,TRUE)
This will return a probability of approximately 0.97725.
We can then use the complementary error function to calculate the probability of a value being greater than 2:
=ERFC.PRECISE(2/ SQRT(2))/2
This will return a probability of approximately 0.02275.
ERFC.PRECISE related functions
- Use ERF function to calculate and returns the error function.
- Use ERF.PRECISE function to return the error function.
- Use ERFC function to return the complementary error function.
