What is ERF function in Excel?
The ERF function is one of the Engineering functions of Excel.
It Calculates and Returns the error function.
We can find this function in ENGINEERING category of the insert function Tab.
How to use ERF function in excel
- Click on an empty cell (like F5).

2. Click on the fx icon (or press shift+F3).

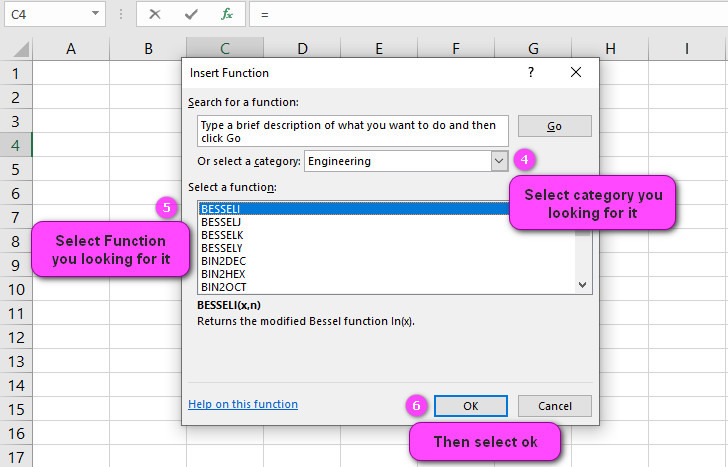
3. In the insert function tab you will see all functions.

4. Select ENGINEERING category.
5. Select ERF function.
6. Then select ok.
7. In the function arguments Tab you will see ERF function.
8. Lower_limit is the lower bound for integrating ERF.
9. Upper_limit is the upper bound for integrating ERF.
10. You will see the results in the formula result section.

Examples of ERF function in Excel
- To calculate the error function of 2, use the formula =ERF(2)
- To calculate the error function of -3, use the formula =ERF(-3)
- To calculate the error function of 1.5, use the formula =ERF(1.5)
- To calculate the error function of -0.75, use the formula =ERF(-0.75)
- To calculate the error function of 0, use the formula =ERF(0)
- To calculate the error function of 4.2, use the formula =ERF(4.2)
- To calculate the error function of -2.8, use the formula =ERF(-2.8)
- To calculate the error function of 0.9, use the formula =ERF(0.9)
- To calculate the error function of -1.2, use the formula =ERF(-1.2)
- To calculate the error function of 3.14159, use the formula =ERF(3.14159)

Excel’s ERF Function: What It Does and How to Use It
The ERF function in Excel is used to calculate the error function, which is a mathematical function commonly used in statistics. The error function describes the probability of a normally distributed variable falling within a certain range of values.
For example, let’s say you are interested in calculating the probability of a randomly selected person’s height falling within 2 standard deviations of the mean height. You could use the ERF function to calculate this probability.
A Step-by-Step Guide to Using the ERF Function in Excel
To use the ERF function in Excel, follow these steps:
- Select the cell where you want to display the result of the ERF function.
- Enter “=ERF(” into the formula bar.
- Enter the required arguments for the ERF function (discussed in the next section).
- Close the parentheses and press Enter to calculate the result.
For example, if you want to calculate the value of the error function at x = 1.5, you would enter “=ERF(1.5)” into the formula bar and press Enter.
Understanding the Syntax of Excel’s ERF Function
The syntax for the ERF function in Excel is as follows:
=ERF(x)
Where “x” is the value at which you want to evaluate the error function. This argument can be a number, a reference to a cell containing a number, or a formula that returns a number.
What Are the Required Arguments for Excel’s ERF Function?
As mentioned earlier, the only required argument for the ERF function is the value at which you want to evaluate the error function. This argument can be a number, a reference to a cell containing a number, or a formula that returns a number.
For example, if you want to evaluate the error function at x = 2, you would use the following formula:
=ERF(2)
Can Excel’s ERF Function Return Negative Values?
Yes, the value returned by the ERF function can be negative. The error function is a continuous function that varies between -1 and 1 as x approaches -infinity and infinity, respectively.
For example, if you want to calculate the value of the error function at x = -0.5, you would enter “=ERF(-0.5)” into the formula bar and press Enter. The result would be a negative number.
Exploring the Range of Values That Excel’s ERF Function Can Calculate
The ERF function in Excel can calculate the error function for any real number. However, as the value of x becomes very large (either positive or negative), the output of the ERF function approaches either 1 or -1, respectively.
For example, if you want to calculate the error function at x = 100, you would use the following formula:
=ERF(100)
The result would be very close to 1.
ERF vs ERFC Functions in Excel: What’s the Difference?
The ERF and ERFC functions are both used to evaluate the error function, but they return slightly different results. The ERF function returns the value of the error function itself, while the ERFC function returns the complementary error function, which is equal to 1 minus the error function.
For example, if you want to calculate the complementary error function at x = 1, you would use the following formula:
=ERFC(1)
The result would be approximately 0.157299207.
Calculating Event Probability with Excel’s ERF Function
You can use the ERF function in Excel to calculate the probability of an event occurring within a normal distribution. To do this, you need to first standardize the variable of interest by subtracting the mean and dividing by the standard deviation. You can then use the ERF function to calculate the probability of the standardized variable falling within a certain range of values.
For example, let’s say you want to calculate the probability of a normally distributed variable falling within 2 standard deviations of the mean. If the mean is 50 and the standard deviation is 10, you would use the following formula:
=ERF((60-50)/(10Sqrt(2)))-ERF((40-50)/(10Sqrt(2)))
The result would be approximately 0.95449974.
How Accurate Are the Results of Excel’s ERF Function?
The accuracy of the results returned by the ERF function in Excel depends on the particular implementation of the algorithm used to calculate the error function. However, for most practical purposes, the ERF function provides accurate results.
For example, if you want to calculate the error function at x = 2, you can use the following formula:
=ERF(2)
The result would be approximately 0.995322265.
Using Excel’s ERF Function for Statistical Analysis: What You Need to Know
The ERF function in Excel is a powerful tool for statistical analysis. It can be used to calculate probabilities, evaluate confidence intervals, and perform hypothesis testing, among other things.
For example, let’s say you want to test the hypothesis that the mean of a normally distributed variable is equal to 10. You could use the ERF function in conjunction with Excel’s built-in statistical functions to calculate the p-value associated with your test statistic.
Working with Complex Numbers in Excel’s ERF Function
The ERF function in Excel can be used to evaluate the error function of complex numbers. To do this, you can use the COMPLEX function to construct a complex number from its real and imaginary parts, and then pass that complex number as an argument to the ERF function.
For example, if you want to calculate the value of the error function at z = 2 + 3i, you would use the following formula:
=ERF(COMPLEX(2,3))
The result would be approximately 0.999593047982555-0.0180522130091677i.
Finding the Inverse of Excel’s ERF Function
Excel does not have a built-in function for finding the inverse of the error function. However, the inverse of the error function can be approximated using numerical methods or by using a lookup table.
For example, if you want to find the value of x such that ERF(x) = 0.8, you could use a lookup table or a root-finding algorithm to approximate the solution.
Using Excel’s ERF Function with Arrays or Ranges
In Excel, you can use the ERF function with arrays or ranges of input values. When using the ERF function with a range of input values, the function will return an array of results.
For example, let’s say you have a range of input values in cells A1:A10, and you want to calculate the value of the error function for each of these values. You would use the following formula:
=ERF(A1:A10)
This would return an array of results corresponding to the error function evaluated at each value in the range.
How to Combine Excel’s ERF Function with Other Statistical Functions
Excel’s ERF function can be combined with other statistical functions to perform more complex calculations. For example, you could use the ERF function in conjunction with Excel’s NORMINV function to calculate the inverse of a normal distribution.
For example, if you want to find the value of x such that the probability of a normally distributed variable falling below x is 0.8, you would use the following formula:
=NORMINV(0.8,0,1*Sqrt(2))*Sqrt(2)
This uses the NORMINV function to find the value of the standard normal distribution corresponding to a probability of 0.8, and then scales this value by Sqrt(2) to get the corresponding value for a normal distribution with mean 0 and standard deviation 1.
The Limitations of Excel’s ERF Function: What You Need to Consider
While Excel’s ERF function is a useful tool for working with error functions, there are some limitations to keep in mind. One limitation is that the accuracy of the results returned by the function may be affected by the specific implementation of the algorithm used to calculate the error function. Additionally, the ERF function may not be appropriate for all types of statistical calculations, and other functions or methods may be more suitable for certain applications.
Graphing Excel’s ERF Function: Tips and Tricks
To graph Excel’s ERF function, follow these steps:
- Open a new or existing Excel workbook.
- Enter the inputs for the ERF function in a column or row.
- In an adjacent column or row, use the ERF function to calculate the output values.
- Highlight both columns and select “Insert” from the menu at the top of the screen.
- Choose the type of chart you want to create (e.g., line chart, scatter plot).
- Customize the chart as desired (e.g., add labels, change colors).
For example, suppose you want to graph the ERF function with x values ranging from -5 to 5 and a mean of 0. To do this, you would enter the x values in one column (e.g., A1:A11) and use the formula “=ERF(A1)” in the adjacent column (e.g., B1:B11). You could then highlight both columns and insert a line chart to visualize the results.
Applying Conditional Formatting to Excel’s ERF Function
Conditional formatting is a useful tool that allows you to highlight cells based on certain conditions. To apply conditional formatting to Excel’s ERF function, follow these steps:
- Select the cells containing the ERF function outputs.
- Choose “Conditional Formatting” from the menu at the top of the screen.
- Select “New Rule.”
- Choose the type of formatting you want to apply (e.g., fill color, font color).
- Specify the condition that triggers the formatting (e.g., values greater than or equal to 0).
- Preview the formatting and adjust as needed.
For example, suppose you have calculated the ERF function outputs for a set of data and want to highlight any values that are greater than 0. To do this, you would select the cells containing the ERF function outputs, choose “Conditional Formatting,” and then select “New Rule.” From there, you could choose to apply a fill color (e.g., green) to any cells that meet the condition “greater than or equal to 0.”
Common Mistakes to Avoid When Using Excel’s ERF Function
When using Excel’s ERF function, there are several common mistakes to avoid:
- Forgetting to specify the mean and standard deviation inputs.
- Entering the mean and standard deviation inputs in the wrong order.
- Using the wrong formula (e.g., ERF.P instead of ERF).
- Forgetting to convert degrees to radians for the ERF.CDF function.
For example, suppose you want to calculate the probability of a value occurring within one standard deviation of the mean. If you forget to specify the mean and standard deviation inputs in the ERF function, the results will be incorrect.
Troubleshooting Errors with Excel’s ERF Function
If you encounter errors when using Excel’s ERF function, there are several steps you can take to troubleshoot the issue:
- Check that you have entered the inputs correctly (e.g., mean, standard deviation).
- Ensure that you are using the correct formula (e.g., ERF vs. ERF.P).
- Verify that you have not made any typos in the formula.
- Check that the input values are within the expected range (e.g., a standard deviation cannot be negative).
For example, suppose you receive an error message when trying to calculate the ERF function output. By double-checking your inputs, verifying the formula, and ensuring that there are no typos, you may be able to identify and resolve the issue.
Resources for Learning More About Excel’s ERF Function
If you want to learn more about Excel’s ERF function, there are several resources available:
- Microsoft’s official Excel documentation provides detailed information on how to use the ERF function, as well as examples and tips.
- Online forums such as Stack Overflow and Quora are great places to ask questions and get advice from experienced Excel users.
- YouTube tutorials and other video content can be a helpful way to learn visually and see real-world examples of the ERF function in action.
For example, suppose you want to improve your understanding of the ERF function and explore different use cases. By consulting Microsoft’s documentation, participating in online forums, and watching YouTube tutorials, you can gain valuable insights and improve your Excel skills.
ERF related functions
- Use ERF.PRECISE function to Return the error function.
- Use ERFC function to return the complementary error function.
- Use ERFC.PRECISE function to return the complementary error function.
