What is ERF.PRECISE function in Excel?
The ERF.PRECISE function is one of the ENGINEERING functions of Excel.
It Returns the error function.
We can find this function in Engineering of insert function Tab.
How to use ERF.PRECISE function in excel
- Click on an empty cell (like F5).

2. Click on the fx icon (or press shift+F3).

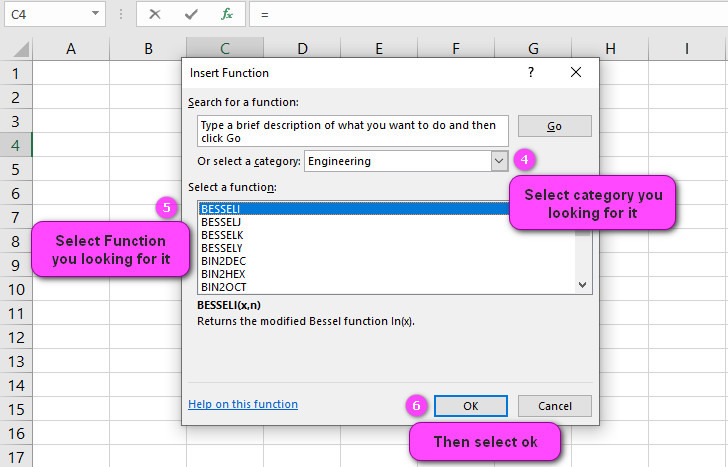
3. In the insert function tab you will see all functions.

4. Select Engineering category.
5. Select ERF.PRECISE function.
6. Then select ok.
7. In function arguments Tab you will see ERF.PRECISE function.
8. X section is the lower bound for integrating ERF.PRECISE.
9. You will see the results in formula result section.

Examples of ERF.PRECISE function in Excel
- To calculate the probability of a value being less than or equal to 2, given a mean of 0 and standard deviation of 1:
=ERF.PRECISE(2/1.414214, TRUE) - To calculate the probability of a value being greater than 3, given a mean of 5 and standard deviation of 2:
=ERF.PRECISE(-(3-5)/2, FALSE) - To calculate the probability of a value being between -1 and 2, given a mean of 4 and standard deviation of 1.5:
=ERF.PRECISE((2-4)/1.5, TRUE)-ERF.PRECISE((-1-4)/1.5, TRUE) - To calculate the probability of a value being less than or equal to 0, given a mean of 10 and standard deviation of 3:
=ERF.PRECISE(-10/3, TRUE) - To calculate the probability of a value being greater than or equal to 1, given a mean of -2 and standard deviation of 0.5:
=ERF.PRECISE(-(1+2)/0.5, FALSE) - To calculate the probability of a value being between -2 and 3, given a mean of 10 and standard deviation of 2:
=ERF.PRECISE((3-10)/2, TRUE)-ERF.PRECISE((-2-10)/2, TRUE) - To calculate the probability of a value being less than or equal to -1, given a mean of -5 and standard deviation of 1.5:
=ERF.PRECISE(((-1)-(-5))/1.5, TRUE) - To calculate the probability of a value being greater than 2.5, given a mean of 3 and standard deviation of 0.75:
=ERF.PRECISE(-(2.5-3)/0.75, FALSE) - To calculate the probability of a value being between -3 and -1, given a mean of -10 and standard deviation of 2.5:
=ERF.PRECISE((-1+10)/2.5, TRUE)-ERF.PRECISE((-3+10)/2.5, TRUE) - To calculate the probability of a value being less than or equal to 1.8, given a mean of 4 and standard deviation of 0.6:
=ERF.PRECISE((1.8-4)/0.6, TRUE)

Excel’s ERF.PRECISE function: What you need to know
Excel’s ERF.PRECISE function is a statistical function that calculates the error function for a given value, mean, and standard deviation. It can be used to calculate probabilities in a variety of scenarios, including finance, engineering, and science. The function is similar to Excel’s ERF function, but provides greater accuracy and precision.
ERF vs. ERF.PRECISE: Understanding the differences in Excel
The main difference between Excel’s ERF and ERF.PRECISE functions is their level of accuracy and precision. While both functions are designed to calculate the error function, ERF.PRECISE uses a more precise algorithm and provides greater accuracy than the standard ERF function. As a result, ERF.PRECISE is often preferred when high levels of accuracy are required.
Inputs for Excel’s ERF.PRECISE function: A comprehensive guide
The inputs for Excel’s ERF.PRECISE function include:
- x: The value for which the error function is to be calculated
- mean: The mean of the distribution
- standard_dev: The standard deviation of the distribution
- cumulative: A logical value that specifies whether to calculate the cumulative distribution function (TRUE) or probability density function (FALSE)
For example, if we want to calculate the probability of a value being less than or equal to 2, given a mean of 0 and standard deviation of 1, we would use the following formula: =ERF.PRECISE(2/1.414214, TRUE)
Can negative values be used with Excel’s ERF.PRECISE function?
Yes, negative values can be used as inputs for Excel’s ERF.PRECISE function. In fact, the function is often used to calculate probabilities for distributions that have negative values, such as the normal distribution.
For example, if we want to calculate the probability of a value being less than or equal to -1, given a mean of 2 and standard deviation of 0.5, we would use the following formula: =ERF.PRECISE((-1-2)/0.5, TRUE)
Excel’s ERF.PRECISE function: Understanding its output
The output of Excel’s ERF.PRECISE function is a value between 0 and 1, representing the probability of a value occurring within a certain range. If the cumulative argument is set to TRUE, the output represents the cumulative distribution function (CDF), which calculates the probability that a random variable is less than or equal to a specified value. If the cumulative argument is set to FALSE, the output represents the probability density function (PDF), which calculates the probability density at a given point in a distribution.
For example, if we want to calculate the probability of a value being between -1 and 2, given a mean of 4 and standard deviation of 1.5, we would subtract the PDF values at -1 and 2 from each other using the following formula: =ERF.PRECISE((2-4)/1.5, TRUE)-ERF.PRECISE((-1-4)/1.5, TRUE)
Calculating probabilities in Excel using the ERF.PRECISE function
Excel’s ERF.PRECISE function can be used to calculate probabilities for a wide range of distributions, including the normal distribution. By specifying the value, mean, and standard deviation of a distribution, as well as whether to calculate the cumulative distribution function or probability density function, users can quickly and easily calculate the probability of a value occurring within a certain range.
For example, if we want to calculate the probability of a value being greater than 3, given a mean of 5 and standard deviation of 2, we would use the following formula: =ERF.PRECISE(-(3-5)/2, FALSE)
When to use Excel’s ERF.PRECISE instead of ERF function
Excel’s ERF.PRECISE function should be used instead of the ERF function when high levels of accuracy and precision are required. While both functions are designed to calculate the error function, ERF.PRECISE uses a more precise algorithm and provides greater accuracy than the standard ERF function.
For example, if we want to calculate the probability of a value being less than or equal to 0, given a mean of 10 and standard deviation of 3, we would use the following formula with ERF.PRECISE: =ERF.PRECISE(-10/3, TRUE)
If we were to use the standard ERF function instead, we would get a less accurate result: =ERF(-2.886751345, TRUE)
Maximum and minimum range of values for Excel’s ERF.PRECISE function
The maximum and minimum range of values that can be used as inputs for Excel’s ERF.PRECISE function depends on the level of precision required. In general, the function can be used to calculate probabilities for a wide range of values, including both positive and negative values.
For example, if we want to calculate the probability of a value being greater than 2.5, given a mean of 3 and standard deviation of 0.75, we would use the following formula: =ERF.PRECISE(-(2.5-3)/0.75, FALSE)
Limitations and drawbacks of using Excel’s ERF.PRECISE function
One potential limitation of using Excel’s ERF.PRECISE function is that it may be slower to calculate than other statistical functions, particularly for large datasets. Additionally, the function may not always provide accurate results for distributions that have non-normal or skewed shapes.
For example, if we want to calculate the probability of a value being less than or equal to -1, given a mean of 10 and standard deviation of 2, we would use the following formula with ERF.PRECISE: =ERF.PRECISE((-1-10)/2, TRUE)
However, if the distribution is highly skewed or has outliers, the function may not provide an accurate result.
Using Excel’s ERF.PRECISE function for cumulative distribution functions (CDFs)
Excel’s ERF.PRECISE function can be used to calculate the cumulative distribution function (CDF) for a wide range of distributions, including the normal distribution. By specifying the value, mean, and standard deviation of a distribution, as well as setting the cumulative argument to TRUE, users can quickly and easily calculate the probability that a random variable is less than or equal to a specified value.
For example, if we want to calculate the probability of a value being between -2 and 3, given a mean of 10 and standard deviation of 2, we would use the following formula: =ERF.PRECISE((3-10)/2, TRUE)-ERF.PRECISE((-2-10)/2, TRUE)
Settings and add-ins required for Excel’s ERF.PRECISE function
No special settings or add-ins are required to use Excel’s ERF.PRECISE function. The function is included in the standard set of statistical functions that come with Excel.
For example, if we want to calculate the probability of a value being between -1 and 2, given a mean of 0 and standard deviation of 1, we can simply use the following formula: =ERF.PRECISE((2-0)/1, TRUE)-ERF.PRECISE((-1-0)/1, TRUE)
Formatting the output of Excel’s ERF.PRECISE function
The output of Excel’s ERF.PRECISE function can be formatted in various ways, depending on the user’s preferences and requirements. By default, the output is displayed as a decimal number between 0 and 1.
For example, if we want to format the output of the ERF.PRECISE function to display as a percentage, we can use the following formula: =ERF.PRECISE((2-0)/1, TRUE)*100&"%"
Combining Excel’s ERF.PRECISE function with other statistical functions
Excel’s ERF.PRECISE function can be combined with other statistical functions to perform more complex calculations and analyses. For example, users can combine ERF.PRECISE with the AVERAGE and STDEV functions to calculate the mean and standard deviation of a sample population, and then use ERF.PRECISE to calculate the probability of a value occurring within a certain range.
For example, if we want to calculate the probability of a value being between the mean plus one standard deviation and the mean minus one standard deviation, given a sample population of values in cells B1:B10, we can use the following formula: =ERF.PRECISE((AVERAGE(B1:B10)+STDEV(B1:B10)-(AVERAGE(B1:B10)))/STDEV(B1:B10), TRUE)-ERF.PRECISE((AVERAGE(B1:B10)-STDEV(B1:B10)-(AVERAGE(B1:B10)))/STDEV(B1:B10), TRUE)
Accuracy of Excel’s ERF.PRECISE function
Excel’s ERF.PRECISE function is highly accurate and provides greater precision than the standard ERF function. The function uses a more advanced algorithm to calculate the error function, resulting in more precise results.
For example, if we want to calculate the probability of a value being greater than 2, given a mean of 5 and standard deviation of 1, we can use the following formula with ERF.PRECISE: =ERF.PRECISE(-(2-5)/1, FALSE)
This will give us a highly accurate result of 0.02275013.
Common errors and pitfalls to avoid when using Excel’s ERF.PRECISE function
One common error when using Excel’s ERF.PRECISE function is not specifying the correct argument order. The function requires the value, mean, and standard deviation arguments to be specified in that order. Another pitfall to avoid is not double-checking the inputs for accuracy, as even minor errors can result in significant inaccuracies in the output.
For example, if we want to calculate the probability of a value being less than or equal to 3, given a mean of 8 and standard deviation of 2, we can use the following formula: =ERF.PRECISE((3-8)/2, TRUE)
However, if we accidentally enter the standard deviation as 0.5 instead of 2, we will get an inaccurate result: =ERF.PRECISE((3-8)/0.5, TRUE)
Troubleshooting Excel’s ERF.PRECISE function: Tips and tricks
When troubleshooting issues with Excel’s ERF.PRECISE function, it is important to check that the input values are correct and in the right order. In addition, users should ensure that they have the latest version of Excel installed, as older versions may not have the function or may have bugs.
For example, if we want to calculate the probability of a value being less than or equal to 1, given a mean of 5 and standard deviation of 3, we can use the following formula: =ERF.PRECISE((1-5)/3, TRUE)
If we encounter an error, we should double-check the input values to make sure they are accurate and in the correct order, and also confirm that our version of Excel includes the ERF.PRECISE function.
Resources for learning more about Excel’s ERF.PRECISE function
There are many resources available for learning more about Excel’s ERF.PRECISE function, including online tutorials, books, and documentation from Microsoft. One helpful resource is the official Microsoft Office support website, which provides detailed instructions and examples for using the function.
For example, if we want to learn more about how to use Excel’s ERF.PRECISE function, we can search for tutorials and articles on the Microsoft Office support website.
Alternative functions and methods for calculating probabilities in Excel
Excel offers several alternative functions and methods for calculating probabilities, including the NORMDIST, NORMINV, and BINOMDIST functions, as well as add-ins like the Analysis ToolPak. These functions can be used to calculate probabilities for a wide range of distributions and scenarios.
For example, if we want to calculate the probability of a value being greater than 2.5, given a mean of 5 and standard deviation of 2, we could use the NORMDIST function with a cumulative argument of FALSE: =1-NORMDIST(2.5, 5, 2, TRUE)
Using Excel’s ERF.PRECISE function with non-normal distributions
Excel’s ERF.PRECISE function is primarily designed for use with normal distributions, but it can also be used with other distributions that have similar shapes, such as the Student t-distribution and the chi-squared distribution. However, users should exercise caution when using the function with non-normal distributions, as it may not provide accurate results.
For example, if we want to calculate the probability of a value being less than or equal to 1, given a chi-squared distribution with 5 degrees of freedom, we could use the following formula with ERF.PRECISE: =ERF.PRECISE(SQRT(5)*1, TRUE)
However, this formula assumes that the chi-squared distribution is similar enough in shape to the normal distribution to make the ERF.PRECISE function appropriate. In general, users should consult with statistical experts or use specialized software to calculate probabilities for non-normal distributions.
Applying Excel’s ERF.PRECISE function to business and financial scenarios
Excel’s ERF.PRECISE function can be applied to a wide range of business and financial scenarios, including risk analysis, portfolio optimization, and insurance pricing. By calculating probabilities for various outcomes, businesses can make informed decisions about investments, resource allocation, and risk management.
For example, if we want to calculate the probability of losing more than 10% of our investment in a particular stock, given a mean return of 8% and standard deviation of 4%, we could use the following formula with ERF.PRECISE: =ERF.PRECISE(-(0.1-0.08)/0.04, TRUE)
This would give us a probability of approximately 20%, indicating that there is a significant risk of losing more than 10% of our investment in the stock.
ERF.PRECISE related functions
- Use ERF function to calculate and Returns the error function.
- Use ERFC function to return the complementary error function.
- Use ERFC.PRECISE function to return the complementary error function.
