What is AVERAGEIFS function in Excel?
The AVERAGEIFS function is one of the Statistical functions of Excel.
It Finds average(arithmetic mean) for the cells specified by a given set of conditions or criteria.
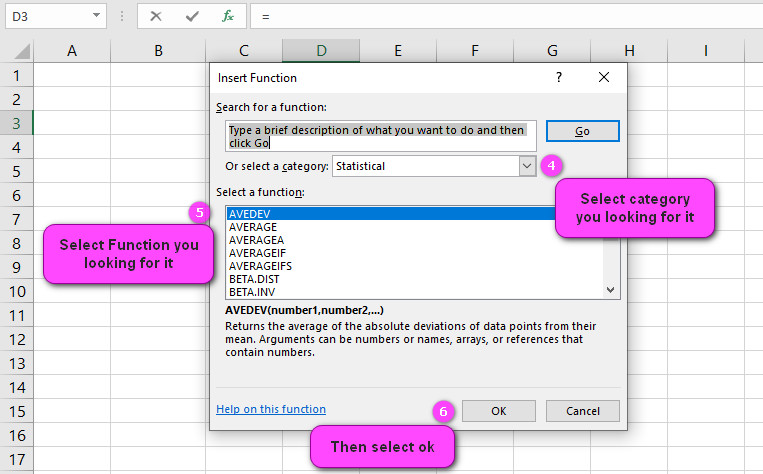
We can find this function in Statistical category of the insert function Tab.
How to use AVERAGEIFS function in excel
- Click on an empty cell (like F5).

2. Click on the fx icon (or press shift+F3).

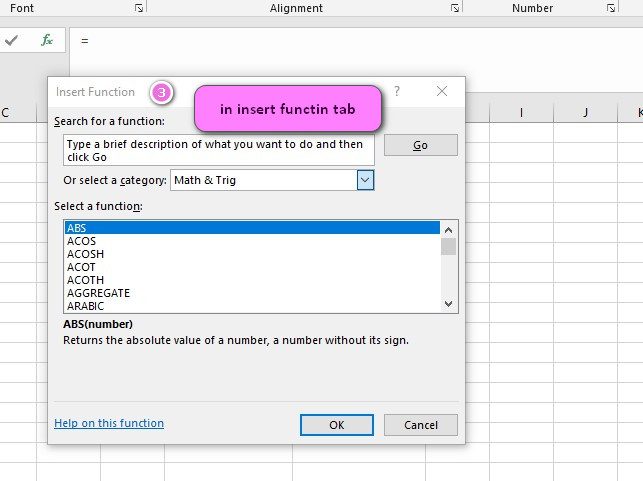
3. In the insert function tab you will see all functions.
4. Select STATISTICAL category.
5. Select AVERAGEIFS function.
6. Then select ok.

7. In the function arguments Tab you will see AVERAGEIFS function.
8. Average range: the actual cells to be used to find the average.
9. Criteria_range1: is the range of cells you want to be evaluated for the particular condition.
10. Criteria1: is the condition or criteria in the form of a number, expression, or text that defines which cells will be used to find the average.
11. You will see the results in the formula result section.
Examples of AVERAGEIFS function in Excel
- Find the average of all sales greater than $1000 made by John:
=AVERAGEIFS(C:C, B:B, "John", C:C, ">1000")
- Find the average of all scores for male students:
=AVERAGEIFS(A:A, C:C, "Male")
- Find the average of all scores greater than 80 for female students:
=AVERAGEIFS(A:A, C:C, "Female", A:A, ">80")
- Find the average of all sales made in January by Susan:
=AVERAGEIFS(C:C, A:A, "January", B:B, "Susan")
- Find the average of all scores for students named John or Mark:
=AVERAGEIFS(A:A, B:B, {"John", "Mark"})
- Find the average of all sales made by Susan or John in February:
=AVERAGEIFS(C:C, A:A, "February", B:B, {"Susan", "John"})
- Find the average of all scores greater than 90 for male students named John:
=AVERAGEIFS(A:A, B:B, "John", C:C, "Male", A:A, ">90")
- Find the average of all sales made by employees in the “Sales” department:
=AVERAGEIFS(C:C, D:D, "Sales")
- Find the average of all scores for students in grade 12:
=AVERAGEIFS(A:A, D:D, 12)
- Find the average of all sales made in Q1 by employees in the “Marketing” department:
=AVERAGEIFS(C:C, D:D, "Marketing", A:A, ">="&DATE(2023,1,1), A:A, "<="&DATE(2023,3,31))Uses of AVERAGEIFS function
AVERAGEIFS based on multiple criteria
The AVERAGEIFS function in Excel is a new function that allows users to calculate the average of a range of values based on multiple criteria. This is useful when you need to find the average of a specific subset of data.
For example, let’s say you have a list of sales records in column A, with corresponding dates in column B and salespersons’ names in column C. To find the average sales for each salesperson on or after January 1st, 2023, use the following formula:
=AVERAGEIFS(C:C, B:B, ">="&DATE(2023,1,1), C:C, "<="&DATE(2023,12,31), D:D, "Sales")
This formula calculates the average sales for all records where the date is on or after January 1st, 2023, the date is on or before December 31st, 2023, and the department is “Sales”.
AVERAGEIF vs AVERAGEIFS: What’s the difference in Excel?
The difference between the AVERAGEIF and AVERAGEIFS functions in Excel is that AVERAGEIF only allows for one criteria, while AVERAGEIFS allows for multiple criteria.
For example, suppose you have a list of scores in column A and corresponding names in column B. To find the average score for all records where the name is “John”, use the following AVERAGEIF formula:
=AVERAGEIF(B:B,"John",A:A)
To find the average score for all male students named John, use the following AVERAGEIFS formula:
=AVERAGEIFS(A:A, B:B, "John", C:C, "Male")
AVERAGEIFS in Excel now supports up to 127 criteria
The AVERAGEIFS function in Excel now allows for up to 127 criteria. This means you can calculate an average based on a large number of conditions.
For example, suppose you have a list of scores in column A, corresponding names in column B, and corresponding genders in column C. To find the average score for male students named John with a score greater than 90, use the following formula:
=AVERAGEIFS(A:A, B:B, "John", C:C, "Male", A:A, ">90")
Use text values as criteria with Excel’s AVERAGEIFS function
You can use text values as criteria with Excel’s AVERAGEIFS function by enclosing the text in double quotes.
For example, let’s say you have a list of sales records in column A, with corresponding departments in column B and salespersons’ names in column C. To find the average sales for all salespeople in the “Marketing” department, use the following formula:
=AVERAGEIFS(A:A, B:B, "Marketing")
This formula calculates the average sales for all records where the department is “Marketing”.
How to use cell color or font style as criteria with AVERAGEIFS in Excel
Excel’s AVERAGEIFS function does not support using cell color or font style as criteria directly. However, you can use a workaround by creating a helper column that uses the CELL function to return the color or font of each cell.
For example, suppose you have a list of sales records in column A, with corresponding departments in column B and salespersons’ names in column C. You want to find the average sales for all records where the department is “Marketing” and the salesperson’s name is in red font. Here are the steps:
- Insert a new column D.
- In cell D2, enter the formula “=CELL(“color”,C2)” to return the font color of the cell in C2.
- Drag the formula down to fill the entire D column.
- Use the following formula to find the average sales for all records where the department is “Marketing” and the salesperson’s name is in red font:
=AVERAGEIFS(A:A, B:B, "Marketing", D:D, 3)
The number 3 represents the RGB value for red font.
Combine AND/OR operators with AVERAGEIFS in Excel for complex calculations
You can combine AND/OR operators with Excel’s AVERAGEIFS function to perform complex calculations based on multiple criteria.
For example, let’s say you have a list of test scores in column A, corresponding names in column B, and corresponding genders in column C. To find the average score for female students named Mary or Jane with a score greater than 90, use the following formula:
=AVERAGEIFS(A:A, B:B, {"Mary", "Jane"}, C:C, "Female", A:A, ">90")
This formula calculates the average score for all records where the name is “Mary” or “Jane”, the gender is “Female”, and the score is greater than 90.
Use wildcards with AVERAGEIFS in Excel for flexible criteria
You can use wildcards with Excel’s AVERAGEIFS function to create flexible criteria that match a broad range of values.
For example, suppose you have a list of sales records in column A, with corresponding product names in column B. To find the average sales for all products that contain the word “Widget” in their name, use the following formula:
=AVERAGEIFS(A:A, B:B, "*Widget*")
This formula calculates the average sales for all records where the product name contains the text “Widget”.
common errors when using AVERAGEIFS in Excel
When using the AVERAGEIFS function in Excel, you may encounter some common errors. Here are some tips to help troubleshoot these errors:
- #VALUE! error: This error occurs when one of the criteria is not valid. Check that all criteria are valid and match the correct data type.
- #DIV/0! error: This error occurs when the formula tries to divide by zero. Check that the denominator range does not contain any zero values.
- #NUM! error: This error occurs when the formula returns a number that is too large or too small to be displayed. Try rounding the result to a smaller number of decimal places.
how to use pivot tables with AVERAGEIFS in Excel for data analysis
Pivot tables are a powerful tool in Excel for data analysis. You can use pivot tables with AVERAGEIFS in Excel to quickly summarize and analyze large datasets.
For example, let’s say you have a list of sales records in columns A through C, with the following headings: “Product Name”, “Department”, and “Sales Amount”. To create a pivot table that shows the average sales amount by department and product name, follow these steps:
- Select the data range.
- Click on the “Insert” tab.
- Click on the “PivotTable” button.
- Choose where you want to place the pivot table and click “OK”.
- Drag the “Department” field to the “Rows” area.
- Drag the “Product Name” field to the “Columns” area.
- Drag the “Sales Amount” field to the “Values” area.
- Click on the dropdown arrow next to “Sales Amount” in the “Values” area and select “Value Field Settings”.
- Choose “Average” and click “OK”.
The resulting pivot table shows the average sales amount by department and product name.
Advanced techniques for using array formulas with AVERAGEIFS in Excel
Array formulas allow you to perform complex calculations based on multiple criteria in Excel. To use an array formula with AVERAGEIFS:
- Select the cell where you want to display the result.
- Type the formula as usual, but do not press enter yet.
- Instead, press Control + Shift + Enter to convert the formula into an array formula.
For example, let’s say you have a list of sales records in column A, with corresponding dates in column B and salespersons’ names in column C. You want to find the average sales for all salespeople named “John” and who made at least one sale in each quarter of the year. Use the following array formula:
=AVERAGEIFS(A:A, C:C, "John",
(B:B>=DATE(2023,1,1))*(B:B<=DATE(2023,3,31))+(B:B>=DATE(2023,4,1))*(B:B<=DATE(2023,6,30))+(B:B>=DATE(2023,7,1))*(B:B<=DATE(2023,9,30))+(B:B>=DATE(2023,10,1))*(B:B<=DATE(2023,12,31)))
This formula calculates the average sales for all records where the name is “John” and there is at least one sale in each quarter of the year.
Using AVERAGEIFS with multiple sheets in Excel
To use AVERAGEIFS with multiple sheets in Excel:
- Select the cell where you want to display the result.
- Type the formula as usual, but replace the data range with a reference to the corresponding sheet.
- Repeat step 2 for each additional sheet.
For example, let’s say you have two sheets named “Sales Q1” and “Sales Q2”, each with a list of sales records in column A and corresponding salespersons’ names in column B. To find the average sales for all salespeople named “John” across both sheets, use the following formula:
=AVERAGEIFS('Sales Q1:Sales Q2'!A:A, 'Sales Q1:Sales Q2'!B:B, "John")
This formula calculates the average sales for all records where the name is “John” in both sheets.
AVERAGEIFS related functions
- Use AVERAGE function to return the average of its arguments, which can be numbers or names, arrays, or references.
- Use AVERAGEIF function to find the average for the cells specified by a given condition or criteria.
- Use AVERAGEA function to return the average of its arguments, evaluating text and FALSE in arguments as 0; TRUE evaluates as 1.
- MODE function


