What is COVARIANCE.S function in Excel?
The COVARIANCE.S function is one of the Statistical functions of Excel.
It returns sample covariance, the average of the products of deviations for
each data point pair in two data sets.
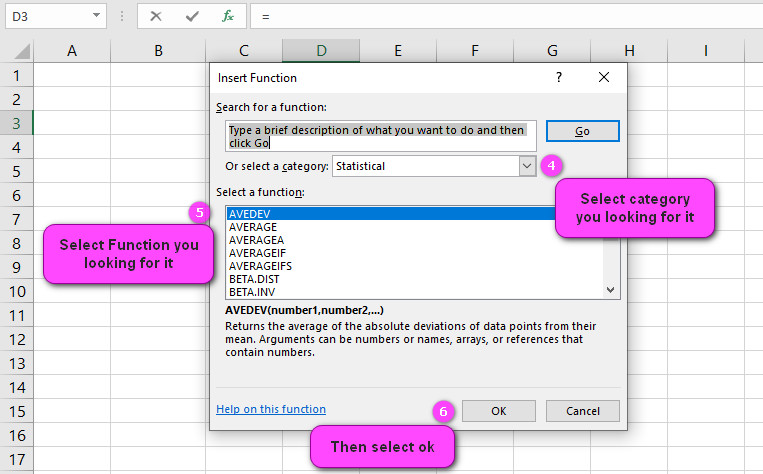
We can find this function in Statistical category of insert function Tab.
How to use COVARIANCE.S function in excel
- Click on an empty cell (like F5).

2. Click on the fx icon (or press shift+F3).

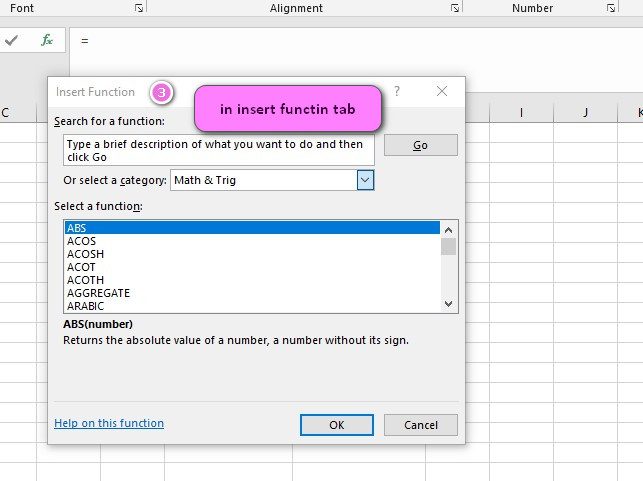
3. In the insert function tab you will see all functions.
4. Select STATISTICAL category.
5. Select COVARIANCE.S function.
6. Then select ok.

7. In the function arguments Tab you will see COVARIANCE.S function.
8. Array1 is the first cell range of integers and must be numbers, arrays, or
references that contain numbers.
9. Array2 is the second cell range of integers and must be numbers, arrays, of
references that contain numbers.
10. You will see the results in the formula result section.
Examples of COVARIANCE.S function in Excel
here are 10 examples of using the COVARIANCE.S function in Excel:
- To calculate the covariance between two sets of data in cells A2:A10 and B2:B10, use the formula =COVARIANCE.S(A2:A10,B2:B10).
- To calculate the covariance between two ranges of data, such as A2:A10 and C2:C10, use the formula =COVARIANCE.S(A2:A10,C2:C10).
- To calculate the covariance between a set of data in column A and a set of data in row 1, use the formula =COVARIANCE.S(A1:A10,1:1).
- To calculate the covariance for a population instead of a sample, use the formula =COVARIANCE.P(A2:A10,B2:B10).
- To calculate the covariance between two arrays, use the formula =COVARIANCE.S({1,2,3},{4,5,6}).
- To calculate the covariance between two named ranges, use the formula =COVARIANCE.S(Range1,Range2), replacing Range1 and Range2 with the actual range names.
- To calculate the covariance between two sets of data in different worksheets, use the formula =COVARIANCE.S(Sheet1!A2:A10,Sheet2!B2:B10).
- To calculate the covariance between two sets of data but ignore any cells that contain errors, use the formula =COVARIANCE.S(IF(ISERROR(A2:A10),””,A2:A10),IF(ISERROR(B2:B10),””,B2:B10)).
- To calculate the covariance between two sets of data but only include values greater than 0, use the formula =COVARIANCE.S(IF(A2:A10>0,A2:A10),IF(B2:B10>0,B2:B10)).
- To calculate the covariance between two sets of data but only include values that meet a certain criteria, use the formula =COVARIANCE.S(IF(A2:A10=”Apples”,B2:B10),IF(A2:A10=”Oranges”,B2:B10)).
The Function of the COVARIANCE.S Function in Excel
The COVARIANCE.S function in Excel calculates the sample covariance, which measures the relationship between two sets of data.
This function is used to determine how much two variables change together.
Using the COVARIANCE.S Function in Excel
To use the COVARIANCE.S function in Excel, you need to provide two arguments: the first argument is the range of cells containing the first set of data values, and the second argument is the range of cells containing the second set of data values. Here’s an example:
Suppose you have two sets of data: A1:A10 contains the values for variable X, and B1:B10 contains the values for variable Y.
To calculate the covariance between these two sets of data, you can use the following formula:
=COVARIANCE.S(A1:A10,B1:B10)
This formula will return the sample covariance between the two sets of data.
Required Arguments for the COVARIANCE.S Function in Excel
The COVARIANCE.S function in Excel requires two arguments: the first argument is the range of cells containing the first set of data values, and the second argument is the range of cells containing the second set of data values. These arguments must be specified in the correct order.
Calculating Covariance Between Two Data Sets in Excel
Yes, the COVARIANCE.S function can be used to calculate the covariance between two data sets. By providing two ranges of cells containing the data sets, the function returns the sample covariance between the two variables. For example, if you have two sets of data in cells A1:A10 and B1:B10, you can calculate the covariance by using the following formula:
=COVARIANCE.S(A1:A10,B1:B10)
This formula will return the sample covariance between the two sets of data. It’s important to keep in mind that the covariance value can range from negative infinity to positive infinity, and a higher absolute covariance value indicates a stronger relationship between the two sets of data.
COVARIANCE.S vs COVARIANCE.P in Excel
COVARIANCE.S and COVARIANCE.P are both Excel functions used to calculate covariance between two datasets. The main difference between them is that COVARIANCE.S assumes the sample data from a population, while COVARIANCE.P assumes that all the data from a population is present.
Using COVARIANCE.S in Excel
When using COVARIANCE.S in Excel, you should use data ranges that represent a sample of the population.
For example, suppose you have two sets of stock prices, A and B, for the past 10 trading days.
You could select those two data ranges (A2:A11 and B2:B11) and enter the formula “=COVARIANCE.S(A2:A11, B2:B11)” into a cell to get the covariance between the two sets.
Interpreting the Result of COVARIANCE.S in Excel
The result obtained from the COVARIANCE.S function in Excel represents the degree to which two variables move together.
A positive value indicates that the variables move in the same direction, while a negative value indicates that they move in opposite directions.
The magnitude of the number represents the strength of the relationship between the two variables.
Automating the Calculation of Covariance in Excel
Yes, there are several ways to automate the calculation of covariance using COVARIANCE.S in Excel. One way is to use the “Data Analysis” tool in Excel.
This tool allows you to perform various statistical analyses, including covariance, on your data. To use this tool, you must first install it by going to “File > Options > Add-Ins > Manage: Excel Add-ins > Go > check ‘Analysis ToolPak’ > OK”.
Once it’s installed, go to “Data > Data Analysis > Covariance” and follow the prompts to select your data ranges and settings.
Another way is to use a formula that automatically updates as new data is added.
For example, you could use the formula “=COVARIANCE.S(A2:INDEX(A:A,COUNT(A:A)), B2:INDEX(B:B,COUNT(B:B)))”, which will automatically update the data ranges as new data is added to columns A and B.
Using COVARIANCE.S to Analyze Financial Data in Excel
COVARIANCE.S can be used to analyze financial data in Excel by calculating the covariance between two sets of financial data, such as stock prices.
For example, suppose you have two sets of stock prices, A and B, and you want to know if they are related.
You could use the COVARIANCE.S function to calculate the covariance between the two sets and determine if there is a correlation between them.
Practical Applications of the COVARIANCE.S Function in Excel
The COVARIANCE.S function in Excel has many practical applications, including risk management, portfolio optimization, and investment analysis.
For example, a portfolio manager might use the COVARIANCE.S function to calculate the covariance between different stocks or assets in order to manage risk and optimize their portfolio.
Using COVARIANCE.S with Non-Numerical Data in Excel
The COVARIANCE.S function in Excel can only be used with numerical data, so it cannot be used with non-numerical data such as text or dates.
If your data contains non-numerical elements, you will need to remove them or convert them to numerical values before using the COVARIANCE.S function.
Finding Standard Deviation Using COVARIANCE.S in Excel
The COVARIANCE.S function in Excel calculates the covariance between two sets of data, not the standard deviation.
However, you can use the result of the COVARIANCE.S function along with other formulas to calculate the standard deviation.
One way to do this is to use the formula “=SQRT(COVARIANCE.S(A2:A11,B2:B11))”, which calculates the standard deviation of the two sets of data based on their covariance.
Limitations of the COVARIANCE.S Function in Excel
One limitation of the COVARIANCE.S function in Excel is that it only measures linear relationships between two variables.
It cannot capture non-linear relationships, such as those that might exist in data that follows a curved trend.
Additionally, the COVARIANCE.S function assumes that the relationship between the two datasets is constant over time, which may not be true for all types of data.
Handling Missing or Null Values in the COVARIANCE.S Function in Excel
When using the COVARIANCE.S function in Excel, missing or null values will be ignored in the calculation.
For example, if you have two sets of data with some missing values, the COVARIANCE.S function will still calculate the covariance based on the available data.
Using COVARIANCE.S to Compare Variability of Different Data Sets in Excel
Yes, you can use the COVARIANCE.S function in Excel to compare the variability of two different data sets.
This can help you determine if the two sets of data are related and how they might be affecting each other.
For example, suppose you have two sets of data, A and B, that represent customer sales and customer satisfaction ratings for a particular product.
You could use the COVARIANCE.S function to determine if there is a relationship between the two sets of data, and how strong that relationship is.
Using COVARIANCE.S to Identify Trends in Data in Excel
The COVARIANCE.S function in Excel is primarily used to measure the relationship between two datasets, rather than identify trends within one dataset.
To identify trends in your data, you may want to use other statistical functions, such as TREND or FORECAST.
However, you can use the result of the COVARIANCE.S function to help inform your analysis of trends by identifying how strongly two sets of data are related.
Common Mistakes to Avoid When Using the COVARIANCE.S
One common mistake when using the COVARIANCE.S function in Excel is to use the wrong data ranges for each dataset.
Make sure that the data ranges you select contain the same number of data points and are from the same time period.
Another mistake is to misinterpret the result of the function as a measure of causation, rather than correlation.
Remember that covariance only measures the degree to which two datasets move together, not whether one causes the other.
Calculating Correlation Coefficient Using COVARIANCE.S in Excel
To calculate the correlation coefficient using the COVARIANCE.S function in Excel, you can divide the result of the COVARIANCE.S function by the product of the standard deviations of the two datasets.
The formula for correlation coefficient is “=COVARIANCE.S(A2:A11,B2:B11)/(STDEV.S(A2:A11)*STDEV.S(B2:B11))“.
This will give you a value between -1 and 1, where -1 represents a perfect negative correlation, 0 represents no correlation, and 1 represents a perfect positive correlation.
Alternative Functions to COVARIANCE.S in Excel
In addition to COVARIANCE.S, there are several alternative functions in Excel that can be used to measure the relationship between two datasets.
These include COVAR, which works similarly to COVARIANCE.S but assumes that the data represents an entire population, and CORREL, which calculates the correlation coefficient directly.
Visualizing Covariance Between Two Data Sets Calculated Using COVARIANCE.S in Excel
One way to visualize the covariance between two data sets calculated using COVARIANCE.S in Excel is to create a scatter plot of the two sets of data.
In a scatter plot, the x-axis represents one set of data and the y-axis represents the other set of data. Each point on the plot represents a pair of corresponding values in the two sets of data.
You can then use the correlation coefficient obtained from the COVARIANCE.S function to add a trendline to the scatter plot, which will help you visualize the relationship between the two sets of data.
COVARIANCE.S related functions
- Use COVARIANCE.P function to return population covariance, the average of the products of deviations for each data point pair in two data sets.


