What is F.INV function in Excel?
The F.INV function is one of the Statistical functions of Excel.
It returns the inverse of the (left-tailed) F probability distribution: if p = F.DIST(x,…), then F.INV(p,…) = x.
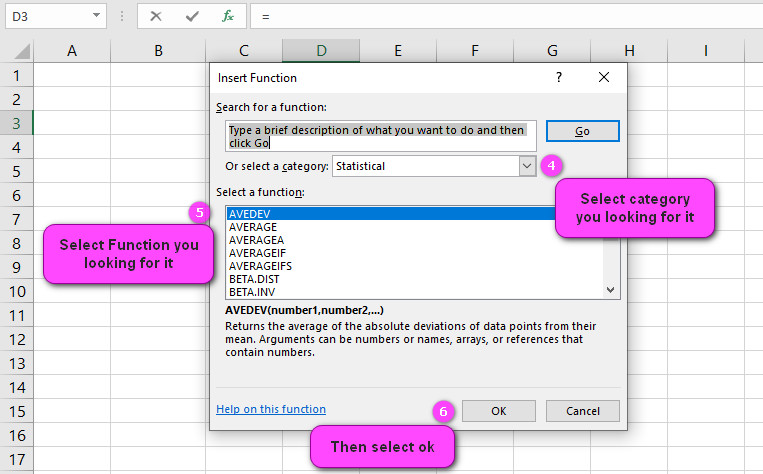
We can find this function in Statistical category of insert function Tab.
How to use F.INV function in excel
- Click on an empty cell (like F5).

2. Click on the fx icon (or press shift+F3).

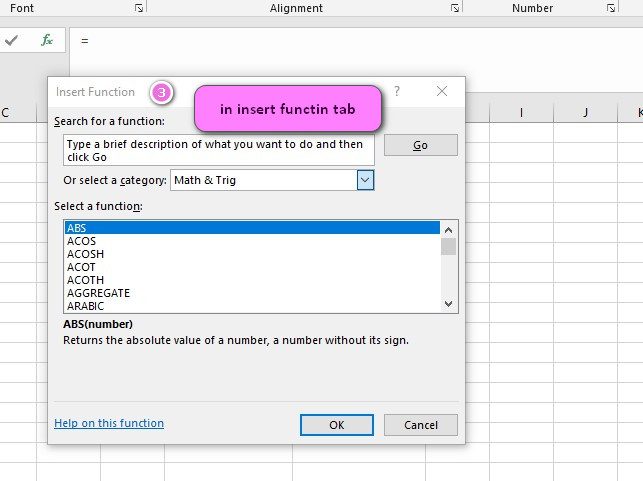
3. In the insert function tab you will see all functions.
4. Select STATISTICAL category.
5. Select F.INV function.
6. Then select ok.

7. In the function arguments Tab you will see F.INV function.
8. Probability is a probability associated with the F cumulative distribution, a number between 0 and 1 inclusive.
9. Deg_freedom1 is the numerator degrees of freedom, a number between 1 and 10^10, excluding 10^10.
10. Deg_freedom2 is the denominator degrees of freedom, a number between 1 and 10^10, excluding 10^10.
11. You will see the results in the formula result section.
Examples of F.INV function in Excel
here are 10 examples of the F.INV function in Excel:
- To calculate the inverse of the F-distribution with a probability of 0.05 and degrees of freedom of 5 and 10, you would use the formula “=F.INV(0.05, 5, 10)“.
- To find the value of x such that the cumulative distribution function for an F-distribution with 3 degrees of freedom in the numerator and 7 degrees of freedom in the denominator is equal to 0.85, you would use the formula “=F.INV(0.85, 3, 7)”.
- To determine the critical value for a two-tailed hypothesis test with alpha=0.05 and degrees of freedom of 8 and 12, you would use the formula “=F.INV(0.025, 8, 12)“.
- To determine the maximum value of a chi-square distribution with 6 degrees of freedom at a significance level of 0.01, you would use the formula “=F.INV(0.01, 6, 0)“.
- To calculate the value of x such that the area under the curve to the right of x for an F-distribution with 4 degrees of freedom in the numerator and 6 degrees of freedom in the denominator is equal to 0.05, you would use the formula “=F.INV.RT(0.05, 4, 6)“.
- To determine the value of x such that the probability density function for an F-distribution with 9 degrees of freedom in the numerator and 15 degrees of freedom in the denominator is equal to 0.03, you would use the formula “=F.INV.DIST(0.03, 9, 15, TRUE)“.
- To calculate the critical value for a one-tailed hypothesis test with alpha=0.01 and degrees of freedom of 6 and 10, you would use the formula “=F.INV(0.01, 6, 10)“.
- To determine the value of x such that the area under the curve to the left of x for an F-distribution with 5 degrees of freedom in the numerator and 8 degrees of freedom in the denominator is equal to 0.95, you would use the formula “=F.INV.LT(0.95, 5, 8)“.
- To calculate the value of x such that the cumulative distribution function for an F-distribution with 2 degrees of freedom in the numerator and 9 degrees of freedom in the denominator is equal to 0.75, you would use the formula “=F.INV(0.75, 2, 9)“.
- To determine the critical value for a two-tailed hypothesis test with alpha=0.01 and degrees of freedom of 4 and 7, you would use the formula “=F.INV(0.005, 4, 7)“.
Excel’s F.INV Function: Syntax, Usage and Differences with F.INV.RT
Microsoft Excel’s F.INV function is used to return the inverse of the F probability distribution, given a specific probability and two degrees of freedom.
Syntax of the F.INV Function:
The syntax of the F.INV function in Excel is as follows:
F.INV(probability, degree_freedom_num, degree_freedom_den)
Argument Definitions:
- probability: This is the probability value between 0 and 1 at which you want to evaluate the inverse F distribution.
- degree_freedom_num: This is the numerator degrees of freedom.
- degree_freedom_den: This is the denominator degrees of freedom.
What the F.INV Function Does in Excel:
The F.INV function in Excel returns the inverse of the F probability distribution. It is also known as the F.inv or Finv function in some versions of Excel.
The F distribution is a continuous probability distribution that arises frequently in statistical inference.
The F.INV function is useful in calculating confidence intervals and hypothesis tests on the ratio of two population variances. It can also be used for ANOVA (Analysis of Variance) calculations.
Arguments of the F.INV Function:
The F.INV function has three arguments, all of which are required:
- The probability argument is a number between 0 and 1. It represents the area under the F distribution curve to the left of the F value for which you want to find the inverse.
- The degree_freedom_num argument is the numerator degrees of freedom, which is an integer greater than or equal to 1.
- The degree_freedom_den argument is the denominator degrees of freedom, which is an integer greater than or equal to 1.
How to Use the F.INV Function in Excel:
To use the F.INV function in Excel, you need to specify the probability and degrees of freedom values as arguments. Here is an example:
Suppose you want to find the inverse of the F distribution for a probability of 0.025, numerator degrees of freedom (df1) of 3, and denominator degrees of freedom (df2) of 5. You can use the F.INV function as follows:
=F.INV(0.025, 3, 5)
In this case, the function returns the value 0.97741.
Difference Between F.INV and F.INV.RT Functions:
The F.INV.RT function is similar to the F.INV function but is used with right-tailed F-tests instead of left-tailed tests.
The F.INV.RT function returns the inverse of the right-tailed F probability distribution, while the F.INV function returns the inverse of the left-tailed F probability distribution.
For example, suppose you have a two-tailed test for which you calculate an F-value of 3.84 and have numerator degrees of freedom (df1) of 4 and denominator degrees of freedom (df2) of 12.
To find the critical value for a significance level alpha of 0.05, you could use either F.INV or F.INV.RT function:
With F.INV:
=F.INV(0.05/2, 4, 12)
This returns the value 3.097.
With F.INV.RT:
=F.INV.RT(0.05, 4, 12)
This also returns the value 3.097.
So, the key difference between the two functions is that F.INV is used for left-tailed tests, while F.INV.RT is used for right-tailed tests.
Determining Degrees of Freedom for F.INV Function
To determine the degrees of freedom for the F.INV function, you need to have the numerator and denominator degrees of freedom.
These values are typically calculated based on the sample size and the number of groups or treatments in the analysis of variance (ANOVA) table.
For example, suppose you have a dataset with two groups and a total sample size of 20.
You would calculate the numerator degrees of freedom as 1 (because there is one group difference being tested) and the denominator degrees of freedom as 18 (because there are 20 observations total minus the number of groups).
F.INV Function Cannot Return Negative Values
The F.INV function is designed to return only positive values. This is because the F-distribution, which the function is based on, is always positive.
If the function returns a negative value, it may indicate an error in your input values or formula.
Using F.INV Function for Hypothesis Testing
Yes, the F.INV function can be used for hypothesis testing. Specifically, it is used to find the critical value of F for a given level of significance and degrees of freedom.
Once you have this value, you can compare it to the calculated F-statistic from your ANOVA test to determine if the null hypothesis should be rejected or not.
For example, suppose you have an ANOVA test with two groups and a calculated F-statistic of 4.5. You want to know if this result is statistically significant at the 95% confidence level.
You would use the F.INV function with a probability of 0.05 and numerator and denominator degrees of freedom of 1 and 18, respectively, to find the critical value of F.
If the critical value is greater than 4.5, you can reject the null hypothesis.
Checking Accuracy of F.INV Function Results
One way to check the accuracy of F.INV function results is to compare them to known values from a table or another software program.
You can also perform a sensitivity analysis by changing your input values slightly and observing how the output changes.
If the output changes significantly, it may indicate an error in your input values or formula.
Handling Errors When Using F.INV Function
When using the F.INV function, you should be aware of common errors such as incorrect input values or formulae, division by zero, or invalid degrees of freedom.
To handle these errors, you can use error handling functions such as IFERROR or ISERROR to return a custom message or value when an error occurs. For example:
=IFERROR(F.INV(0.05,1,18),"Error: Check Input Values")
This formula will return the critical value of F for a 95% confidence level and numerator and denominator degrees of freedom of 1 and 18, respectively.
If an error occurs, it will display the message “Error: Check Input Values” instead of a numerical value.
F.INV Function for Paired T-Tests
The F.INV function in Excel can be used to calculate the p-value for a paired t-test. This function takes two arguments: the alpha level and the degrees of freedom for the numerator and denominator.
To use the F.INV function for a paired t-test, you first need to calculate the F-statistic using the formula:
F = (S1^2 / n) / (S2^2 / n)
where S1^2 and S2^2 are the sample variances for the paired differences, and n is the sample size.
Converting F-Statistic to P-Value
Once you have calculated the F-statistic, you can use the F.INV function to find the p-value.
The F.INV function returns the inverse of the cumulative distribution function (CDF) for the F-distribution.
To convert the F-statistic to a p-value, you need to subtract the F-statistic from 1 and then use the F.INV function to find the critical value at that level.
For example, let’s say you have an F-statistic of 5.32 with 10 degrees of freedom for the numerator and 12 degrees of freedom for the denominator. To find the p-value:
=F.INV(1-0.05/2, 10, 12)
This will return a critical value of 3.054. Since our F-statistic (5.32) is larger than the critical value (3.054), we can reject the null hypothesis at the 0.05 level of significance.
The p-value for this test is therefore less than 0.05.
Choosing Alpha Level
When using the F.INV function, the appropriate value for alpha depends on the desired level of significance. Common choices for alpha include 0.05, 0.01, and 0.001.
Comparing Results with Other Statistical Software
It is important to note that the results obtained from the F.INV function may differ slightly from those obtained using other statistical software due to differences in rounding and numerical methods.
Common Mistakes to Avoid
When using the F.INV function, it is important to ensure that you are using the correct degrees of freedom for the numerator and denominator, and that you have correctly calculated the F-statistic.
It is also important to remember that the F-distribution is only valid for continuous data, and that assumptions about normality and equal variances should be checked before conducting a paired t-test.
F.INV related functions
- USE F.DIST function to return the F probability distribution for two data sets.
- Use F.DIST.RT function to return the exponential distribution.
- Use F.INV.RT function to return the (right-tailed) F probability distribution (degree of diversity) for two data sets.
- Use F.TEST function to return the inverse of the (left-tailed) F probability distribution: if p = F.DIST(x,…), then F.INV(p,…) = x.


