What is FISHERINV function in Excel?
The FISHERINV function is one of the Statistical functions of Excel.
It returns the inverse of the Fisher transformation: if y = FISHER(x), then FISHERINV(y) = x.
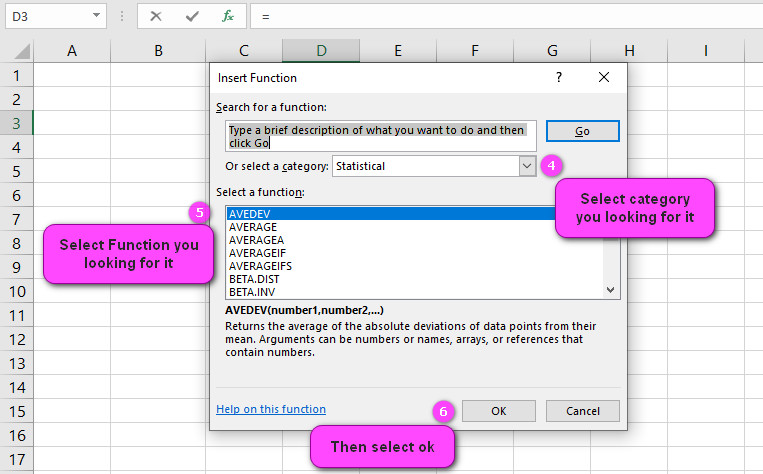
We can find this function in Statistical category of insert function Tab.
How to use FISHERINV function in excel
- Click on an empty cell (like F5).

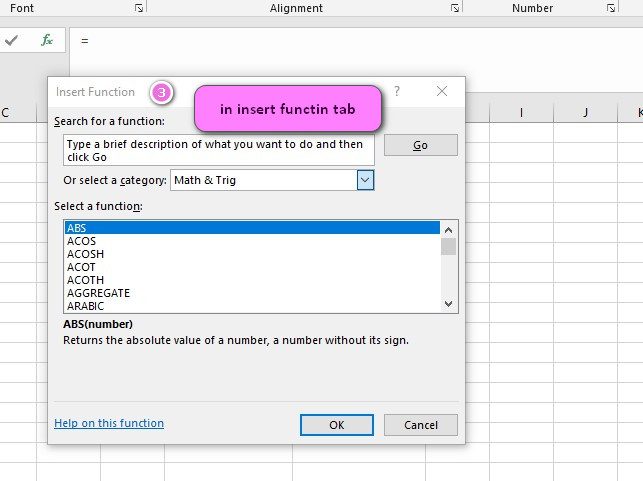
2. Click on the fx icon (or press shift+F3).

3. In the insert function tab you will see all functions.
4. Select STATISTICAL category.
5. Select FISHERINV function.
6. Then select ok.

7. In the function arguments Tab you will see FISHERINV function.
8. Y is the value for which you want to perform the inverse of the transformation.
9. You will see the results in the formula result section.
Examples of FISHERINV function in Excel
Here are 10 examples of the FISHERINV function in Excel:
- =FISHERINV(0.2) – returns the inverse hyperbolic tangent of 0.2, which is approximately 0.20273255.
- =FISHERINV(A2) – returns the inverse hyperbolic tangent of the value in cell A2.
- =FISHERINV(0.5) – returns the inverse hyperbolic tangent of 0.5, which is exactly 0.
- =FISHERINV(0.9) – returns the inverse hyperbolic tangent of 0.9, which is approximately 1.47221949.
- =FISHERINV(B2) – returns the inverse hyperbolic tangent of the value in cell B2.
- =FISHERINV(0.8) – returns the inverse hyperbolic tangent of 0.8, which is approximately 1.09861229.
- =FISHERINV(C2) – returns the inverse hyperbolic tangent of the value in cell C2.
- =FISHERINV(-0.2) – returns the inverse hyperbolic tangent of -0.2, which is approximately -0.20273255.
- =FISHERINV(D2) – returns the inverse hyperbolic tangent of the value in cell D2.
- =FISHERINV(-0.9) – returns the inverse hyperbolic tangent of -0.9, which is approximately -1.47221949.
What is the Fisherinv function in Excel and how does it work?
The Fisherinv function is a statistical function in Excel that converts a value from its Fisher transformation back to its original scale.
The Fisher transformation is a mathematical procedure used to stabilize the variance of correlation coefficients, making them more suitable for hypothesis testing.
How do I use the Fisherinv function in Excel to convert a value from its Fisher transformation back to its original scale?
To use the Fisherinv function in Excel to convert a value from its Fisher transformation back to its original scale, follow these steps:
- Enter the Fisher transformation of the value in a cell using the FISHER function.
- Enter the formula “=FISHERINV(value)” in a new cell, where “value” is the cell containing the Fisher transformation of the original value.
- Press Enter to display the converted value in the new cell.
Can I use the Fisherinv function in Excel to analyze correlation coefficients?
Yes, the Fisherinv function can be used in Excel to analyze correlation coefficients. It is often used to calculate confidence intervals and perform hypothesis tests on correlation coefficients.
Are there any limitations to using the Fisherinv function in Excel?
Yes, there are some limitations to using the Fisherinv function in Excel. For example, it can only be used to convert values that have been transformed using the Fisher transformation.
It also assumes that the data follows a normal distribution, which may not always be the case in real-world applications.
How do I handle errors or inaccuracies when using the Fisherinv function in Excel?
If you encounter errors or inaccuracies when using the Fisherinv function in Excel, there are several steps you can take to correct them.
First, make sure that the data you are analyzing is accurate and complete. Check for any missing or incomplete data and fill in the gaps as needed.
You can also use other Excel functions and tools, such as IF statements or data validation, to check for errors and inconsistencies in your data.
Finally, be sure to double-check your formulas and calculations to ensure that they are working correctly.
Can I use the Fisherinv function in Excel to perform hypothesis testing?
Yes, you can use the Fisherinv function in Excel to perform hypothesis testing. The function is used to calculate the inverse of the Fisher transformation of a correlation coefficient.
By using this transformation, we can determine whether the correlation coefficient is statistically significant.
How accurate is the Fisherinv function in Excel when dealing with large datasets?
The accuracy of the Fisherinv function depends on the size of the dataset and the value of the correlation coefficient being analyzed.
In general, the Fisher transformation becomes more accurate as the sample size increases.
However, if the correlation coefficient is very close to 1 or -1, the accuracy of the transformation may be reduced.
Can the Fisherinv function in Excel be used to analyze non-linear data sets?
No, the Fisherinv function is only applicable to linear relationships between two variables.
If the relationship between the variables is non-linear, other statistical analysis methods should be used.
How do I use the Fisherinv function in Excel to calculate confidence intervals?
To calculate a confidence interval for a correlation coefficient using the Fisherinv function, you first need to calculate the Fisher transformation of the correlation coefficient.
You can then calculate the standard error of the transformed correlation coefficient, which can be used to calculate the upper and lower bounds of the confidence interval.
For example, let’s say you have a sample size of 100 and a correlation coefficient of 0.6.
To calculate the 95% confidence interval for this correlation coefficient using the Fisherinv function in Excel, you could use the following formula:
FISHERINV(0.6) +/- 1.96 * SQRT(1 / (100 - 3))
Where 0.6 is the correlation coefficient, 1.96 is the z-score associated with a 95% confidence level, and 100 is the sample size.
The -3 in the denominator of the square root reflects the number of variables being analyzed (in this case, two).
Are there any alternative functions to the Fisherinv function in Excel?
Yes, there are other functions in Excel that can be used to perform hypothesis testing and calculate confidence intervals for correlation coefficients.
For example, you could use the CORREL function to calculate the correlation coefficient, and then use the TINV function to calculate a confidence interval based on a t-distribution.
However, the Fisher transformation is a commonly used method due to its ability to normalize the distribution of correlation coefficients, making them easier to compare and analyze.
Can I apply the Fisherinv function in Excel to non-numerical data sets?
No, you cannot apply the Fisherinv function in Excel to non-numerical data sets.
The Fisherinv function is used to calculate the inverse of the Fisher transformation, which is only applicable to numerical data.
How do I interpret the results of the Fisherinv function in Excel?
The results of the Fisherinv function in Excel represent the original data values that were transformed using the Fisher transformation.
This transformation is often used to convert a correlation coefficient (r) to a value that has a more normal distribution and can be used in statistical tests.
The result of the Fisherinv function is the original correlation coefficient (r) before it was transformed.
What are some practical applications for using the Fisherinv function in Excel?
The Fisherinv function in Excel is commonly used in statistics and data analysis to perform hypothesis testing, specifically when analyzing the correlation between two variables.
In addition, it can also be used to calculate confidence intervals and test for significance.
For example, if you have two sets of data and want to test whether there is a significant correlation between them, you can use the Fisher transformation to convert the correlation coefficient (r) to a Z-score, then use the Z-score to calculate a p-value.
The Fisherinv function can then be used to convert the Z-score back to the original correlation coefficient (r).
Can I use the Fisherinv function in Excel to perform time series analysis?
No, the Fisherinv function in Excel is not typically used for time series analysis.
Time series analysis involves analyzing patterns in time-based data, and the Fisher transformation is generally used for analyzing the correlation between two variables.
How do I use the Fisherinv function in Excel to calculate p-values?
To use the Fisherinv function in Excel to calculate p-values, you would first need to calculate the Z-score for the transformed data using the NORMSINV function.
Once you have the Z-score, you can use the standard normal distribution to calculate the p-value.
For example, if you have a correlation coefficient of 0.75 and want to test whether it is statistically significant, you would first apply the Fisher transformation using the FISHER function in Excel.
This would give you a transformed value of 0.972955074. You can then use the NORMSINV function to calculate the Z-score:
=NORMSINV(0.972955074)
This would give you a Z-score of 1.97. You can then use the standard normal distribution to calculate the two-tailed p-value:
=2*(1-NORMDIST(ABS(1.97),0,1,TRUE))
This would give you a p-value of approximately 0.049, indicating that the correlation coefficient is statistically significant at the 5% level.
Finally, you can use the Fisherinv function to convert the transformed value back to the original correlation coefficient:
Copy Code=FISHERINV(0.972955074)
This would give you an original correlation coefficient of 0.75.
Using Fisherinv function in Excel
The Fisherinv function in Excel is used to estimate the strength of a relationship between two variables.
It transforms a correlation coefficient (r) into a normally distributed variable, which can be further analyzed using statistical techniques.
To use the Fisherinv function in Excel:
- Enter the correlation coefficient (r) that you want to transform into a normally distributed variable.
- Type the following formula into a cell: =FISHERINV(r)
- Press enter to obtain the transformed value.
For example, imagine that you have a correlation coefficient of 0.7 between two variables in cells A1 and B1.
To transform this correlation coefficient into a normally distributed variable, type the following formula into a new cell:
Copy Code=FISHERINV(A1:B1)
Using Fisherinv function in machine learning and statistical modeling
The Fisherinv function in Excel can be used in machine learning and statistical modeling to transform correlation coefficients or other variables into normally distributed variables.
These variables can then be analyzed using various statistical techniques, such as regression analysis or hypothesis testing.
For example, suppose you are building a predictive model to forecast sales based on different marketing campaigns.
You could use the Fisherinv function to transform the correlation coefficients between each marketing campaign and sales into normally distributed variables.
You could then use these variables as predictors in a regression model to identify which marketing campaigns are most effective in driving sales.
Common mistakes to avoid when using Fisherinv function in Excel
Some common mistakes to avoid when using the Fisherinv function in Excel include:
- Forgetting to input the correlation coefficient (r) as the argument for the Fisherinv function
- Using an invalid value for the correlation coefficient (e.g., a value outside the range of -1 to 1)
- Not understanding the interpretation of the resulting transformed variable (it is not a correlation coefficient anymore)
Optimizing the performance of Fisherinv function in Excel
To optimize the performance of the Fisherinv function in Excel, you can take the following steps:
- Use the latest version of Excel, which may have improved calculation speed.
- Minimize the number of times the Fisherinv function is used in your spreadsheet by using it only where necessary.
- Avoid using complex formulas or large datasets that could slow down calculation time.
Troubleshooting issues with Fisherinv function in Excel
If you are experiencing issues with the Fisherinv function in Excel, try the following troubleshooting steps:
- Check that the input correlation coefficient (r) is within the range of -1 to 1.
- Verify that you are using the correct formula syntax and referencing the correct cells.
- Consider using other statistical functions in Excel to corroborate your results and identify any discrepancies.
FISHERINV related functions
- Use FISHER function to return the Fisher transformation.


