What is FORECAST.ETS.SEASONALITY function in Excel?
The FORECAST.ETS.SEASONALITY function is one of the Statistical functions of Excel.
It returns the length of the repetitive pattern Microsoft Excel detects for the specified time series.
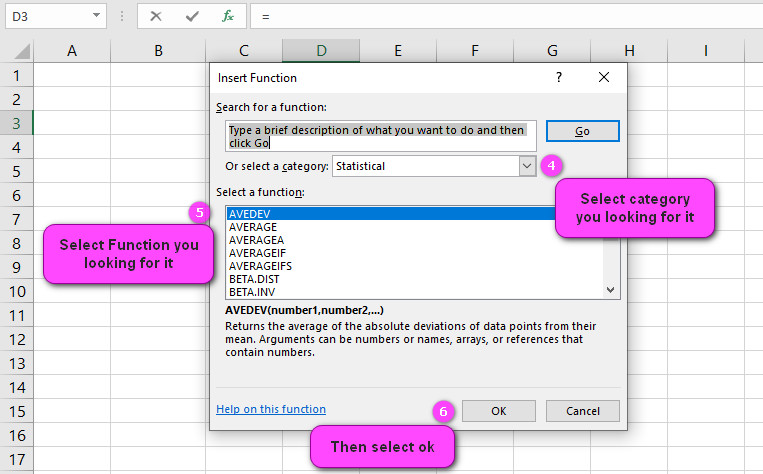
We can find this function in Statistical of insert function Tab.
How to use FORECAST.ETS.SEASONALITY function in excel
- Click on an empty cell (like F5).

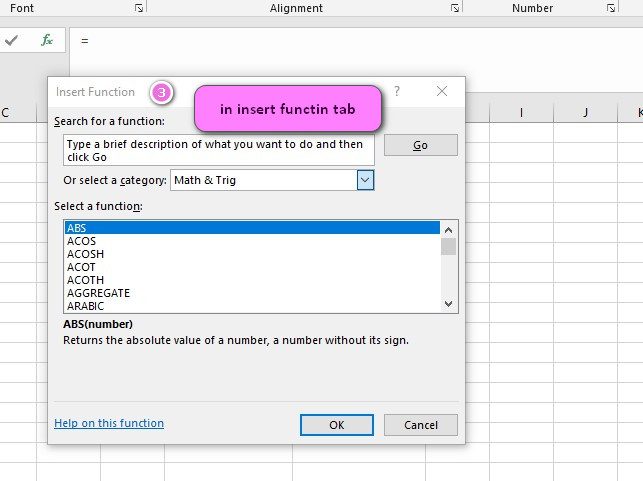
2. Click on the fx icon (or press shift+F3).

3. In the insert function tab you will see all functions.
4. Select STATISTICAL category.
5. Select FORECAST.ETS.SEASONALITY function.
6. Then select ok.

7. In the function arguments Tab you will see FORECAST.ETS.SEASONALITY function.
8. Values are the array or range of numeric data you’re predicting.
9. Timeline is the independent array or range of numeric data. The dates in the timeline must have a consistent step between them and can’t be zero.
10. Data_completion is an optional value for handling missing values. The default value of 1 replaces missing values by interpolation, and O replaces them with zeros.
11. Aggregation is an optional numeric value for aggregating multiple values with the same time stamp. If blank, Microsoft Excel averages the values.
12. You will see the results in the formula result section.


