What is GAUSS function in Excel?
The GAUSS function is one of the Statistical functions of Excel.
It returns 0.5 less than the standard normal cumulative distribution.
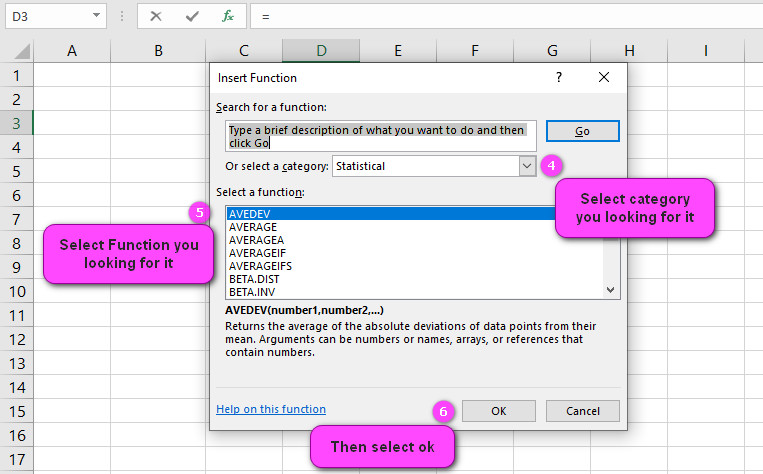
We can find this function in Statistical category of insert function Tab.
How to use GAUSS function in excel
- Click on an empty cell (like F5).

2. Click on the fx icon (or press shift+F3).

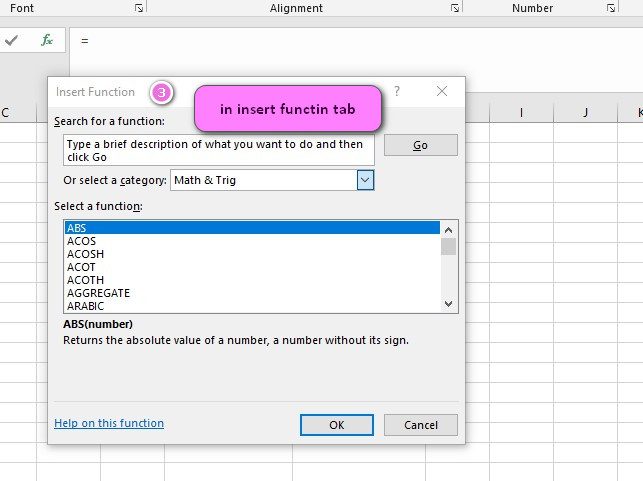
3. In the insert function tab you will see all functions.
4. Select STATISTICAL category.
5. Select GAUSS function.
6. Then select ok.

7. In the function arguments Tab you will see GAUSS function.
8. X is the value for which you want the distribution.
9. You will see the results in the formula result section.
Examples of GAUSS function in Excel
here are 10 examples of the GAUSS function in Excel:
- =GAUSS(0) – returns the probability of a standard normal distribution with a mean of 0 and a standard deviation of 1.
- =GAUSS(1.5) – returns the probability of a standard normal distribution with a mean of 0 and a standard deviation of 1 for a value of 1.5.
- =GAUSS(-1.25) – returns the probability of a standard normal distribution with a mean of 0 and a standard deviation of 1 for a value of -1.25.
- =GAUSS(A2) – returns the probability of a standard normal distribution with a mean of 0 and a standard deviation of 1 for a value in cell A2.
- =GAUSS(2, 1, TRUE) – returns the cumulative probability of a normal distribution with a mean of 2 and a standard deviation of 1 for a value less than or equal to the x value.
- =GAUSS(3, 2, FALSE) – returns the probability density function of a normal distribution with a mean of 3 and a standard deviation of 2 for an x value.
- =GAUSS(0.5, 0, 1) – returns the probability density function of a standard normal distribution with a mean of 0 and a standard deviation of 1 for an x value of 0.5.
- =GAUSS(6, 4, 2) – returns the probability density function of a normal distribution with a mean of 6 and a standard deviation of 4 for an x value of 2.
- =GAUSS(3, 3, 1) – returns the cumulative probability of a normal distribution with a mean of 3 and a standard deviation of 3 for a value less than or equal to the x value.
- =GAUSS(2.5, 2, 0.5) – returns the probability density function of a normal distribution with a mean of 2 and a standard deviation of 0.5 for an x value of 2.5.
What is Gauss in Excel and how does it work?
Gauss is a mathematical function in Excel that calculates the sum of a series of numbers.
It is named after the German mathematician Carl Friedrich Gauss, who developed the formula for calculating the sum of an arithmetic series.
The Gauss function in Excel uses this formula to calculate the sum of a range of numbers.
How do I use the Gauss function in Excel to find the sum of a range of numbers?
To use the Gauss function in Excel to find the sum of a range of numbers, follow these steps:
- Select a blank cell where you want to display the result.
- Type “=GAUSS(” and then select the range of cells that contains the numbers you want to include in the calculation.
- Close the parentheses and press Enter.
The formula should look something like this: =GAUSS(A1:A5)
Can I use the Gauss function in Excel to calculate the standard deviation of a set of data?
No, the Gauss function in Excel cannot be used to calculate the standard deviation of a set of data. The function only calculates the sum of a series of numbers.
Is there a way to use the Gauss function in Excel to find the median of a set of values?
No, the Gauss function in Excel cannot be used to find the median of a set of values. The function only calculates the sum of a series of numbers.
What are some practical applications for using the Gauss function in Excel?
The Gauss function in Excel can be useful in a variety of applications, such as calculating the total revenue or expenses for a set of transactions, or finding the total number of items in a list.
It can also be used to calculate the sum of a series of integers, which can be helpful in coding and programming tasks.
Are there any limitations to using the Gauss function in Excel?
Yes, there are some limitations to using the Gauss function in Excel. One limitation is that it is a user-defined function (UDF), which means that it must be installed and enabled before it can be used.
Another limitation is that it may not be as accurate as other statistical functions in Excel, particularly when dealing with small datasets or non-normal distributions.
Can I use the Gauss function in Excel to find the mode of a set of data?
No, the Gauss function cannot be used to find the mode of a set of data in Excel.
The mode is the most frequently occurring value in a dataset, and it requires a different formula or function to calculate.
How accurate is the Gauss function in Excel when dealing with large datasets?
The accuracy of the Gauss function in Excel when dealing with large datasets depends on a variety of factors, including the precision of the input data and the distribution of values in the dataset.
Generally, the Gauss function should be reasonably accurate for large datasets, but it may be less accurate than other statistical functions in Excel that are specifically designed for large datasets.
Are there any alternative functions to the Gauss function in Excel?
Yes, there are several alternative functions to the Gauss function in Excel, including the AVERAGE and MEDIAN functions for calculating central tendency, the STDEV and VAR functions for calculating variance and standard deviation, and the SKEW and KURT functions for measuring skewness and kurtosis.
Can I use the Gauss function in Excel to calculate the coefficient of variation?
Yes, you can use the Gauss function in Excel to calculate the coefficient of variation, which is a measure of the relative variability of a dataset. The formula for the coefficient of variation is:
=STDEV(range)/AVERAGE(range)
You can use the Gauss function to calculate the standard deviation component of this formula, like this:
=Gauss(range)/AVERAGE(range)
How do I use the Gauss function in Excel to calculate the skewness of a dataset?
To use the Gauss function in Excel to calculate the skewness of a dataset, you need to have the Analysis ToolPak add-in installed.
Here’s how to use the function:
- Select a blank cell where you want to display the result.
- Type “=SKEW.P(” and then select the range of cells that contains the data you want to include in the calculation.
- Close the parentheses and press Enter.
The formula should look something like this: =SKEW.P(A1:A5)
The SKEW.P function returns the skewness of the dataset, which is a measure of the asymmetry of the distribution.
Are there any tips or tricks for optimizing the performance of the Gauss function in Excel?
Yes, here are some tips for optimizing the performance of the Gauss function in Excel:
- Minimize the size of the dataset as much as possible to reduce the amount of processing required by the function.
- Avoid using nested functions within the Gauss function, as this can slow down performance.
- Use the latest version of Excel, as newer versions may have improved performance optimizations.
Can the Gauss function in Excel be used to forecast future trends based on historical data?
No, the Gauss function in Excel is not designed for forecasting future trends based on historical data. It is primarily used to analyze and describe existing datasets.
How do I handle errors or inaccuracies when using the Gauss function in Excel?
If the Gauss function returns an error or inaccurate result, you should first double-check your input data to make sure it is accurate and complete.
If you still encounter issues, try using other statistical functions or tools to cross-check your results. Additionally, you can consult online resources or seek assistance from a statistics expert.
Can I apply the Gauss function in Excel to non-numerical data sets?
No, the Gauss function in Excel is designed to work with numerical data sets only. If you try to apply the function to non-numerical data, it will return a #VALUE! error.
How do I use the Gauss function in Excel to generate random numbers?
The Gauss function in Excel is used to generate normally distributed random numbers.
To use the Gauss function, follow these steps:
- Select a blank cell where you want to display the random number.
- Type “=GAUSS(” and then specify the mean and standard deviation of the distribution as arguments.
- Close the parentheses and press Enter.
The formula should look something like this: =GAUSS(0,1)
This formula generates a random number from a standard normal distribution with a mean of 0 and a standard deviation of 1.
What are some common mistakes to avoid when using the Gauss function in Excel?
Some common mistakes to avoid when using the Gauss function in Excel include:
- Forgetting to specify the mean and standard deviation arguments
- Specifying the standard deviation as zero
- Using non-numeric values for the mean or standard deviation
- Using the result of the Gauss function without understanding its meaning or context
How do I use the Gauss function in Excel to calculate confidence intervals?
To use the Gauss function in Excel to calculate confidence intervals, you can use the following formula:
=mean + (z-score x (standard deviation/square root of sample size))
In this formula, “mean” is the sample mean, “standard deviation” is the sample standard deviation, and “sample size” is the number of observations in the sample.
The value of “z-score” depends on the desired level of confidence and is typically obtained from a standard normal distribution table.
You can use the Gauss function in Excel to obtain the z-score and calculate the confidence interval based on the formula above.
Can the Gauss function in Excel be used for machine learning or statistical modeling?
Yes, the Gauss function in Excel can be used for machine learning or statistical modeling in certain contexts.
It is commonly used in regression analysis, where the goal is to model the relationship between one or more independent variables and a dependent variable.
The Gauss function can be used to generate normally distributed random errors in the modeling process.
However, for more complex machine learning tasks, other software platforms or programming languages may be more appropriate than Excel.
How do I troubleshoot issues when using the Gauss function in Excel?
If you are having issues with the Gauss function in Excel, there are several steps you can take to troubleshoot the problem.
These include:
- Checking that the mean and standard deviation arguments are correct
- Verifying that the sample size is accurate and that any missing data points are appropriately accounted for
- Ensuring that the z-score is obtained from a reliable source or calculation
- Checking that the resulting confidence interval makes sense in the context of the data and research question
- Considering whether Excel is the best tool for the particular analysis needed


