What is FILTER Function in Excel?
The FILTER function is one of the Lookup & reference functions of Excel.
It extracts all record from the database that matches the specified conditions.
We can find this function in the Lookup & reference of the insert function Tab.
How to use FILTER function in excel
- Click on an empty cell (like F5 ).

2. Click on the fx icon (or press shift+F3).

3. In the insert function tab you will see all functions.

4. Select Lookup & reference category.
5. Select the FILTER function.
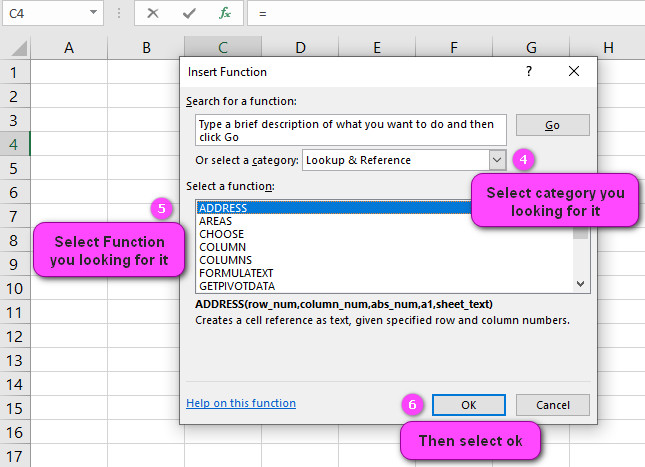
6. Then select ok.
7. In the function arguments Tab you will see the FILTER function.
8. Array is the range or array to filter.
9. Include an array of booleans where TRUE represents a row or column to retain.
10. If_emty is returned if no item is retained.
11. You will see the result in formula result section.

Examples of FILTER function in excel
Example 1:
how to find data in a table with FILTER function
We want to find the height, age, and weight of a person named “Elijah” from the following data

=FILTER(A5:D14,A5:A14="Elijah")
answer is  {Elijah,22,198,185}
Example 2:
how to filter data in a table with FILTER function
We want to find the height, age, and weight of a person named “Noah” from the following data

=FILTER(A5:D14,A5:A14="Noah")
answer is  {Noah,25,205,235;Noah,29,199,231;Noah,22,204,190}
Example 3:
Find the multiple criteria with FILTER function
We can filter multiple criteria in Excel in different ways:
logical AND operator :
In this case, we use the multiplication operator (*) to return all the values in the range of our array.

=FILTER(A6:D15,(A6:A15="Noah" )*(B6:B15=22))
answer is  {Noah,22,204,190}
logical OR operator :
In this case, we use the multiplication operator (+) to return all the values in the range of our array.

=FILTER(A6:D15,(A6:A15="Noah" )+(B6:B15=22))Example 4:
How can extract specific record from table in excel?
By using FILTER function, we can extract a specific record from table in excel
For example, in the table below, we want to know how old is benjamin?
| Name | Age | Height | Weight |
| Olivia | 25 | 210 | 180 |
| Noah | 25 | 205 | 235 |
| Oliver | 27 | 195 | 205 |
| Elijah | 22 | 198 | 185 |
| James | 29 | 199 | 231 |
| William | 29 | 201 | 240 |
| Benjamin | 21 | 202 | 235 |
| Lucas | 25 | 200 | 238 |
| Henry | 22 | 204 | 190 |

=FILTER(A7:D16,(A7:A16="benjamin" ))
answer is  {Benjamin,21,202,235}
Example 5:
How can extract Values greater or smaller than a certain number?
We can extract Values greater or smaller than a certain number.
For example, in the table above, we want to know Who is taller than 201?

=FILTER(A8:D16,(C8:C16>201 ))
answer is  {Benjamin,21,202,235}
Filter Function in Excel: How to Easily Sort and Organize Your Data
Excel’s FILTER function is a powerful tool for sorting and organizing large datasets. By allowing you to filter data based on specific criteria, you can quickly and easily narrow down your results and focus on the data that’s most relevant to your analysis. This can help streamline your workflow and make your data easier to understand.
Example: Suppose you have a sales report with columns for product names, prices, quantities sold, and revenue, and you want to filter the data to show only products with a price greater than $50. You could use the FILTER function with the GREATER THAN operator to create a formula that filters the data based on the specified criteria, like this: “=FILTER(A2:E10,B2:B10>50)”.
Maximizing Efficiency: Using Excel’s Filter Function to Quickly Analyze Large Datasets
Excel’s FILTER function can greatly increase efficiency when working with large datasets. By allowing you to quickly sort and organize your data based on specific criteria, you can save time and effort when analyzing and interpreting your data. This makes it easier to draw conclusions and make decisions based on your findings.
Example: Suppose you have a dataset of customer information with columns for name, address, phone number, and email. If you want to filter the data to show only customers who live in a specific region, you could use the FILTER function with the EQUALS TO operator to create a formula that filters the data based on the specified criteria, like this: “=FILTER(A2:E100,C2:C100=”North”)”.
Simplify Your Data Analysis with Excel’s Filter Function
Excel’s FILTER function can simplify your data analysis by allowing you to quickly and easily sort and organize your data based on specific criteria. This can help you identify patterns and trends within your data that might otherwise be difficult to see. By simplifying your data analysis, you can make more informed decisions and take action based on your findings.
Example: Suppose you have a dataset of sales data with columns for product names, prices, quantities sold, and revenue. If you want to filter the data to show only products that meet certain criteria, such as being in a certain price range or having a high volume of sales, you could use the FILTER function with the appropriate operators to create a formula that filters the data based on those criteria.
Get the Most Out of Your Data: Tips and Tricks for Excel’s Filter Function
Excel’s FILTER function is a powerful tool for working with large datasets, but there are several tips and tricks you can use to get even more out of it. Some of these include using multiple criteria to filter your data, using wildcards to search for specific values, and combining the FILTER function with other functions and formulas for more complex analysis.
Example: Suppose you have a dataset of customer information with columns for name, address, phone number, and email. If you want to filter the data to show only customers who live in a specific region and have a certain email domain, you could use the FILTER function with multiple criteria and wildcard characters to create a formula that filters the data based on those criteria, like this: “=FILTER(A2:E100,(C2:C100=”North”)*(D2:D100=”*gmail.com“))”.
Excel’s Filter Function: A Powerful Tool for Data Management and Analysis
Excel’s FILTER function is a powerful tool for managing and analyzing data. By allowing you to quickly and easily sort and organize your data based on specific criteria, you can streamline your workflow and make more informed decisions based on your findings. Whether you’re working with large or small datasets, Excel’s FILTER function can help you get the most out of your data.
Example: Suppose you have a sales report with columns for product names, prices, quantities sold, and revenue. If you want to filter the data to show only products with a price greater than $50 and sold in a certain region, you could use the FILTER function with multiple criteria to create a formula that filters the data based on those conditions, like this: “=FILTER(A2:E10,(B2:B10>50)*(D2:D10=”North”))”.
Mastering Excel’s Filter Function: Streamline Your Data Analysis Workflow
Mastering Excel’s FILTER function is essential for streamlining your data analysis workflow. By understanding its syntax and how it works with other functions and formulas, you can create complex filters that narrow down your results and focus on the data that’s most relevant to your analysis. With practice, you can become a master of Excel’s FILTER function and greatly increase efficiency when working with data.
Example: Suppose you have a dataset of customer information with columns for name, age, address, and phone number. If you want to filter the data to show only customers who are over the age of 30 and live in a certain zip code, you could use the FILTER function with multiple criteria and the AND function to create a formula that filters the data based on those conditions, like this: “=FILTER(A2:E100,(B2:B100>30)*AND(ISNUMBER(FIND(“90210″,C2:C100))))”.
Effortlessly Find the Information You Need with Excel’s Filter Function
Effortlessly finding the information you need is easy with Excel’s FILTER function. By allowing you to quickly and easily sort and organize your data based on specific criteria, you can narrow down your results and focus on the data that’s most relevant to your analysis. This can help you find the information you need faster and more efficiently than traditional data analysis methods.
Example: Suppose you have a dataset of employee information with columns for name, department, job title, and salary. If you want to filter the data to show only employees in a certain department who earn over a certain amount, you could use the FILTER function with multiple criteria to create a formula that filters the data based on those conditions, like this: “=FILTER(A2:E50,(B2:B50=”Sales”)*(D2:D50>50000))”.
Excel’s Filter Function: Simplifying Complex Data Analysis Tasks
Excel’s FILTER function can simplify complex data analysis tasks by allowing you to quickly and easily sort and organize your data based on specific criteria. This can help you identify patterns and trends within your data that might otherwise be difficult to see. By simplifying complex data analysis tasks, you can make more informed decisions and take action based on your findings.
Example: Suppose you have a sales report with columns for product names, prices, quantities sold, and revenue, and you want to filter the data to show only products that meet certain criteria, such as being in a certain price range or having a high volume of sales. You could use the FILTER function with the appropriate operators and values to create a formula that filters the data based on those criteria, like this: “=FILTER(A2:E10,(B2:B10>50)*(C2:C10<1000))”.
Filter Function 101: Everything You Need to Know to Get Started with Excel’s Filter Feature
Excel’s FILTER function is a powerful tool for sorting and organizing data. If you’re new to the feature, there are several things you should know before getting started. These include understanding its syntax, knowing how to use different comparison operators like EQUALS TO or GREATER THAN, and practicing with different data sets to get familiar with the feature.
Example: Suppose you have a dataset of employee information with columns for name, department, job title, and salary. If you want to filter the data to show only employees in a certain department, you could use the FILTER function with the EQUALS TO operator to create a formula that filters the data based on those conditions, like this: “=FILTER(A2:E50,B2:B50=”Sales”)”.
Customizing Your Data Analysis: Advanced Techniques for Excel’s Filter Function
Excel’s FILTER function can be customized in a variety of ways to perform more advanced data analysis tasks. By combining it with other functions and formulas, you can create complex filters that narrow down your results and focus on the data that’s most relevant to your analysis. Some advanced techniques include using regular expressions, creating custom functions, and filtering by date range.
Example: Suppose you have a sales report with columns for product names, prices, quantities sold, and revenue, and you want to filter the data to show only products sold within a specific date range. You could use the FILTER function with the operator “greater than or equal to” and “less than or equal to” to create a formula that filters the data based on the specified criteria, like this: “=FILTER(A2:E10,(D2:D10>=DATE(2022,1,1))*(D2:D10<=DATE(2022,3,31)))”.
Excel’s Filter Function: The Key to Efficient Data Sorting and Categorization
Excel’s FILTER function is essential for efficient data sorting and categorization. By allowing you to quickly and easily sort and organize your data based on specific criteria, you can narrow down your results and focus on the data that’s most relevant to your analysis. Whether you’re working with large or small datasets, Excel’s FILTER function can help you get the most out of your data.
Example: Suppose you have a dataset of customer information with columns for name, age, address, and phone number. If you want to filter the data to show only customers who are over the age of 30 and live in a certain zip code, you could use the FILTER function with multiple criteria and the AND function to create a formula that filters the data based on those conditions, like this: “=FILTER(A2:E100,(B2:B100>30)*AND(ISNUMBER(FIND(“90210″,C2:C100))))”.
From Chaos to Order: Taming Your Data with Excel’s Filter Function
Excel’s FILTER function can help tame chaotic data by allowing you to quickly and easily sort and organize it based on specific criteria. By narrowing down your results and focusing on the data that’s most relevant to your analysis, you can make more informed decisions and take action based on your findings. This can help transform chaotic data into an organized and useful resource.
Example: Suppose you have a sales report with columns for product names, prices, quantities sold, and revenue, but the data is disorganized and difficult to work with. You could use the FILTER function to sort and organize the data based on specific criteria, such as showing only products with a high volume of sales or revenue generated. By taming your data with Excel’s FILTER function, you can turn chaos into order and make better use of your data.
Excel’s Filter Function Demystified: Tips and Tricks for a Smooth Data Analysis Experience
Excel’s FILTER function can be daunting, but with the right tips and tricks, you can use it to streamline your data analysis experience. Some tips include using wildcard characters to search for specific values, combining multiple criteria using logical functions like AND or OR, and filtering by color or icon. With practice and experimentation, you can master Excel’s FILTER function and make your data analysis workflow more efficient.
Example: Suppose you have a dataset of customer information with columns for name, age, address, and phone number. If you want to filter the data to show only customers who live in a certain region and have a certain age range, you could use the FILTER function with wildcard characters and logical operators to create a formula that filters the data based on those conditions, like this: “=FILTER(A2:E100,(C2:C100= “North“)(B2:B100>=30)(B2:B100<=40))”.
The Power of Excel’s Filter Function: Making Sense of Your Data Has Never Been Easier
Excel’s FILTER function is a powerful tool for making sense of large datasets. By allowing you to quickly and easily sort and organize your data based on specific criteria, you can narrow down your results and focus on the data that’s most relevant to your analysis. This can help you identify patterns and trends within your data that might otherwise be difficult to see, making data analysis easier than ever before.
Example: Suppose you have a sales report with columns for product names, prices, quantities sold, and revenue, and you want to filter the data to show only products with a high volume of sales and revenue generated. You could use the FILTER function with appropriate operators to create a formula that filters the data based on those criteria, like this: “=FILTER(A2:E10,(C2:C10>50)*(D2:D10>5000))”.
Excel’s Filter Function: An Essential Tool for Data-Driven Decision Making
Excel’s FILTER function is an essential tool for data-driven decision making. By allowing you to quickly and easily sort and organize your data based on specific criteria, you can narrow down your results and focus on the data that’s most relevant to your analysis. This can help you make informed decisions based on your findings and increase the accuracy of your analyses.
Example: Suppose you have a dataset of employee information with columns for name, department, job title, and salary. If you want to filter the data to show only employees in a certain department who earn over a certain amount, you could use the FILTER function with multiple criteria to create a formula that filters the data based on those conditions, like this: “=FILTER(A2:E50,(B2:B50=”Sales”)*(D2:D50>50000))”.
Unlocking the Full Potential of Excel’s Filter Function for Accurate Data Analysis
Excel’s FILTER function has immense potential when it comes to accurate data analysis. By using its various features and capabilities, including multiple criteria, logical functions, wildcard characters, and more, you can create complex filters that narrow down your results and focus on the data that’s most relevant to your analysis. With practice and experimentation, you can unlock the full potential of Excel’s FILTER function and take your data analysis skills to the next level.
Example: Suppose you have a sales report with columns for product names, prices, quantities sold, and revenue, and you want to filter the data to show only products that meet certain criteria, such as being in a certain price range or having a high volume of sales. You could use the FILTER function with the appropriate operators and values to create a formula that filters the data based on those criteria, like this: “=FILTER(A2:E10,(B2:B10>50)*(C2:C10<1000))”. By experimenting with different filter criteria and using the full range of Excel’s FILTER function features, you can unlock its full potential for accurate data analysis.
xcel’s Filter Function: A Complete Guide to Simplifying Your Data Analysis Process
Excel’s FILTER function is a powerful tool for simplifying your data analysis process. By allowing you to quickly and easily sort and organize your data based on specific criteria, you can narrow down your results and focus on the data that’s most relevant to your analysis. This complete guide covers all aspects of the FILTER function, including its syntax, operators, logical functions, and advanced techniques.
Example: Suppose you have a sales report with columns for product names, prices, quantities sold, and revenue, and you want to filter the data to show only products with a high volume of sales and revenue generated. You could use the FILTER function with appropriate operators to create a formula that filters the data based on those criteria, like this: “=FILTER(A2:E10,(C2:C10>50)*(D2:D10>5000))”.
Streamlining Your Data Analysis Workflow: Excel’s Filter Function Made Simple
Excel’s FILTER function can streamline your data analysis workflow by allowing you to quickly and easily sort and organize your data based on specific criteria. By narrowing down your results and focusing on the data that’s most relevant to your analysis, you can make more informed decisions in less time. This guide simplifies the FILTER function by breaking down its features and functionality into easy-to-follow steps.
Example: Suppose you have a dataset of employee information with columns for name, department, job title, and salary. If you want to filter the data to show only employees in a certain department who earn over a certain amount, you could use the FILTER function with multiple criteria to create a formula that filters the data based on those conditions, like this: “=FILTER(A2:E50,(B2:B50=”Sales”)*(D2:D50>50000))”.
Excel’s Filter Function: An Invaluable Tool for Effective Data Management
Excel’s FILTER function is an invaluable tool for effective data management. By allowing you to quickly and easily sort and organize your data based on specific criteria, you can keep your data organized and up-to-date. This guide covers the features and benefits of the FILTER function for effective data management, including sorting by color or icon, using wildcard characters, and combining multiple criteria.
Example: Suppose you have a dataset of customer information with columns for name, age, address, and phone number. If you want to filter the data to show only customers who live in a certain region and have a certain age range, you could use the FILTER function with wildcard characters and logical operators to create a formula that filters the data based on those conditions, like this: “=FILTER(A2:E100,(C2:C100= “North“)(B2:B100>=30)(B2:B100<=40))”.
Data Analysis at Your Fingertips: How to Effectively Use Excel’s Filter Function
Excel’s FILTER function puts data analysis at your fingertips by allowing you to quickly and easily sort and organize your data based on specific criteria. By narrowing down your results and focusing on the data that’s most relevant to your analysis, you can make more informed decisions and take action based on your findings. This guide covers the basics of the FILTER function and provides tips for using it effectively in your data analysis workflow.
Example: Suppose you have a sales report with columns for product names, prices, quantities sold, and revenue. If you want to filter the data to show only products with a price greater than $50 and sold in a certain region, you could use the FILTER function with multiple criteria to create a formula that filters the data based on those conditions, like this: “=FILTER(A2:E10,(B2:B10>50)*(D2:D10=”North”))”. By following the tips and techniques in this guide, you can use Excel’s FILTER function to effectively analyze your data and make informed decisions.
FILTER related functions :
- UNIQUE function
- SORT function
- SORTBY function
- SEQUENCE function
- RANDARRAY function

