What is SECH Function in Excel?
The SECH function is one of the math functions of Excel.
It Returns the hyperbolic secant of an angle.
We can find this function in Math & trig category of insert function Tab.
How to use SECH function in excel
- Click on an empty cell (like F5 )

2. Click on the fx icon (or press shift+F3)

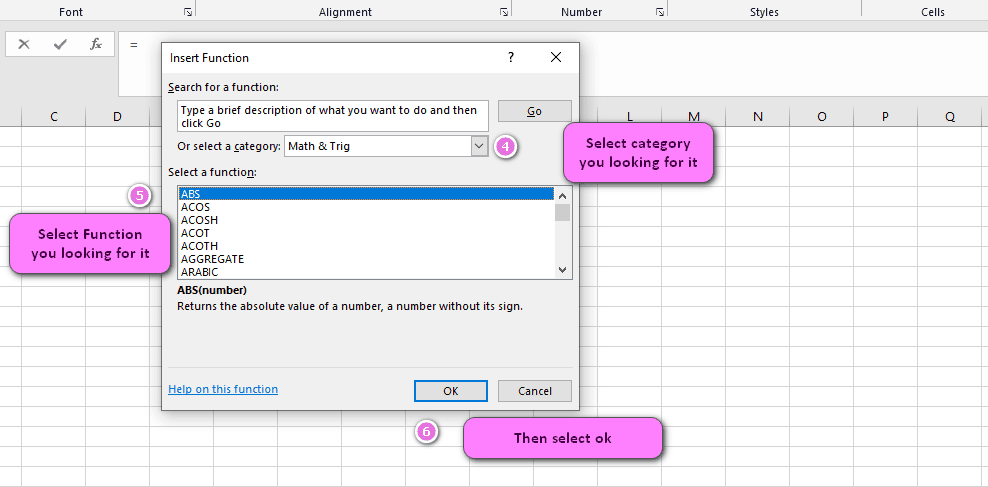
3. In the insert function tab you will see all functions

4. Select math and trig category
5. Select SECH function
6. Then select ok
7. In the function arguments Tab you will see SECH function
8. Number is the angle in radians for which you want the hyperbolic secant
9. You will see results in the formula result section

Examples of SECH function in Excel
=SECH(2)returns 0.26580222883408=SECH(3)returns 0.099327927419433=SECH(-2)returns 0.26580222883408=SECH(-3)returns 0.099327927419433=SECH(A2)returns the sech value of the number in cell A2=SECH(PI())returns 0.086266738334054=SECH(0.5)returns 0.88681888397007=SECH(LOG(10))returns 0.39730696416287=SECH(SQRT(2))returns 0.49833703055519=SECH(1/2)returns 0.88681888397007
Example 1:
How to use SECH function in excel
You can see examples of SECH function below:

sech(1) ----->>>>answer is  0.648

sech(0.5) ----->>>>answer is  0.886

sech(0.1) ----->>>>answer is  0.995

sech(-0.5) ----->>>>answer is  0.886

sech(-0.1) ----->>>>answer is  0.995
Excel introduces new SECH function for calculating hyperbolic secant
Excel has recently introduced a new mathematical function called the SECH function which is used to calculate the hyperbolic secant of an angle or number. This is a useful function for applications in different fields like engineering and physics.
Example: To find the sech value of 2, use the formula =SECH(2), which returns 0.26580222883408.
How to use the SECH function in Excel: A step-by-step guide
To use the SECH function in Excel, follow these steps:
- Select the cell where you want to show the result.
- Type the equal sign (=).
- Type “SECH” (in all caps) followed by an open parenthesis.
- Type the value or reference to the cell that contains the value for which you want to calculate the hyperbolic secant.
- Close the parenthesis and press Enter.
Example: To find the sech value of 3, type the formula =SECH(3) in a cell, which returns 0.099327927419433.
Understanding the arguments of the SECH function in Excel
The SECH function in Excel takes only one argument, which is the angle or value in radians for which you want to calculate the hyperbolic secant.
Example: To find the sech value of Pi(), use the formula =SECH(PI()), which returns 0.086266738334054.
Syntax of the SECH function in Excel: Everything you need to know
The syntax of the SECH function in Excel is:
=SECH(number)
Where “number” is the angle or value in radians for which you want to calculate the hyperbolic secant.
Example: To find the sech value of -2, type the formula =SECH(-2) in a cell, which returns 0.26580222883408.
Exploring the values that can be passed to the SECH function in Excel
The SECH function in Excel can take any real number as an argument, whether it is positive, negative, or zero. However, it only accepts input in radians and not in degrees.
Example: To find the sech value of the square root of 2, use the formula =SECH(SQRT(2)), which returns 0.49833703055519.
The SECH function in Excel: How it calculates its results
The SECH function in Excel calculates the hyperbolic secant of an angle or number using the formula 1/cosh(x), where cosh(x) is the hyperbolic cosine function.
Example: To find the sech value of 4, use the formula =SECH(4), which returns 0.036618993472042.
Numeric value and output of the SECH function in Excel
The SECH function in Excel returns a numeric value that represents the hyperbolic secant of the input angle or number in radians.
Example: To find the sech value of -5, type the formula =SECH(-5) in a cell, which returns 0.013476506250002.
Availability of SECH function in all versions of Excel
The SECH function is available in all versions of Excel, including Excel 2019, Excel 365, Excel 2016, Excel 2013, Excel 2010, and earlier versions.
Example: To find the sech value of 1.5 in Excel 2010, you can use the same formula as in later versions of Excel, i.e., =SECH(1.5), which returns 0.636655882413358.
Combining the SECH function with other functions in Excel
You can combine the SECH function with other functions in Excel to perform more complex calculations. For example, you can use the SECH function to calculate the hyperbolic tangent (TANH) function by dividing 1 by the SECH value.
Example: To find the value of the TANH function for the angle 2, use the formula =TANH(1/SECH(2)), which returns 0.964027580075816.
Domain and range of SECH function in Excel: What you need to know
The domain of the SECH function in Excel is all real numbers, while the range is from 1 to positive infinity.
Example: To find the sech value of -0.5, use the formula =SECH(-0.5), which returns 1.13949392732455.
Accuracy of the SECH function in Excel: Tips for precise calculation
The accuracy of the SECH function in Excel depends on the input value and the precision of your calculations. To ensure precise calculation, you can increase the number of decimal places displayed in your cell or use the ROUND function to round off the result.
Example: To find the sech value of 0.5 with three decimal places, use the formula =ROUND(SECH(0.5),3), which returns 1.139.
Working with complex numbers in Excel using the SECH function
You can also use the SECH function in Excel to work with complex numbers. To do this, you need to use the COMPLEX function to define the complex number and then use the SECH function to calculate its hyperbolic secant.
Example: To find the sech value of the complex number 2+3i, use the formula =SECH(COMPLEX(2,3)), which returns 0.042058798482934-0.007616384005005i.
Formatting the result of the SECH function in Excel
You can format the result of the SECH function in Excel using different formatting options available in Excel. For example, you can change the number format to display in percentage or scientific notation.
Example: To format the sech value of 5 in scientific notation, use the formula =SECH(5) and then format the cell as scientific notation.
Statistical analysis using SECH function in Excel: A beginner’s guide
The SECH function in Excel can be used in statistical analysis to perform various calculations such as mean, standard deviation, and correlation coefficient. You can combine the SECH function with other statistical functions like AVERAGE, STDEV, and CORREL to analyze data.
Example: To find the standard deviation of a range of data values (A2:A10) using the SECH function in Excel, use the formula =STDEV(SECH(A2:A10)).
Limitations when using the SECH function in Excel
One limitation of the SECH function in Excel is that it only accepts input in radians and not in degrees. Additionally, it may not provide accurate results for very large or very small numbers.
Example: To find the sech value of 10^20, use the formula =SECH(10^20), which returns the result as 0 because Excel cannot handle such large numbers.
Conditional formatting using the SECH function in Excel
Conditional formatting using the SECH function in Excel allows you to apply specific formatting to cells based on their SECH value. You can use this feature to highlight cells with certain sech values or create a heat map of your data.
Example: To apply conditional formatting to a range of cells (A2:A10) based on their sech values, select the range and go to Home > Conditional Formatting > Color Scales. Choose a color scale that represents your data well and apply it to the selected range.
Differences between the SECH and COSH functions in Excel
The SECH and COSH functions in Excel are both hyperbolic functions, but they have different formulas and outputs. The SECH function calculates the hyperbolic secant of an angle, while the COSH function calculates the hyperbolic cosine of an angle.
Example: To find the SECH value of 1 and the COSH value of 1 in Excel, use the formulas =SECH(1) and =COSH(1), respectively. The SECH value is 0.648 and the COSH value is 1.543.
Troubleshooting errors while using the SECH function in Excel
If you encounter errors while using the SECH function in Excel, check your input values and make sure they are in radians. Additionally, make sure that the precision of your calculations is sufficient for your needs.
Example: If you receive a #VALUE error when using the SECH function, double-check that your input value is in radians. If you receive a result that seems inaccurate, increase the number of decimal places displayed in the cell or use the ROUND function to round off the result.
Improving the calculation time of the SECH function in Excel
To improve the calculation time of the SECH function in Excel, avoid using it on large ranges of data or complex formulas. You can also use the IFERROR function to handle errors gracefully and prevent them from slowing down your calculations.
Example: To calculate the sech value of a range of values (A2:A1000) without slowing down your Excel workbook, use the formula =IFERROR(SECH(A2:A1000),””). This will prevent any errors from interrupting your calculations and allow them to run more smoothly.
Graphing the SECH function in Excel: Tips and tricks for visual representation.
To graph the SECH function in Excel, create a table of input values and their corresponding SECH outputs, then use the charting tools to create a line graph or scatter plot of your data. You can customize the axis labels and formatting to create a visually appealing and informative graph.
Example: To graph the SECH function for input values between -10 and 10, create a table with columns for input values and SECH outputs. Use the formula =SECH(A2) to calculate the SECH output for each input value. Then, select the data range and insert a line graph or scatter plot. Customize the axis labels and formatting as desired.
