What is SUMX2MY2 Function in Excel?
The SUMX2MY2 function is one of the math functions of Excel.
It Sums the differences between the squares of two corresponding ranges or arrays.
We can find this function in Math & trig category of insert function Tab.
How to use SUMX2MY2 function in excel
- Click on an empty cell (like F5 )

2. Click on fx icon (or press shift+F3)

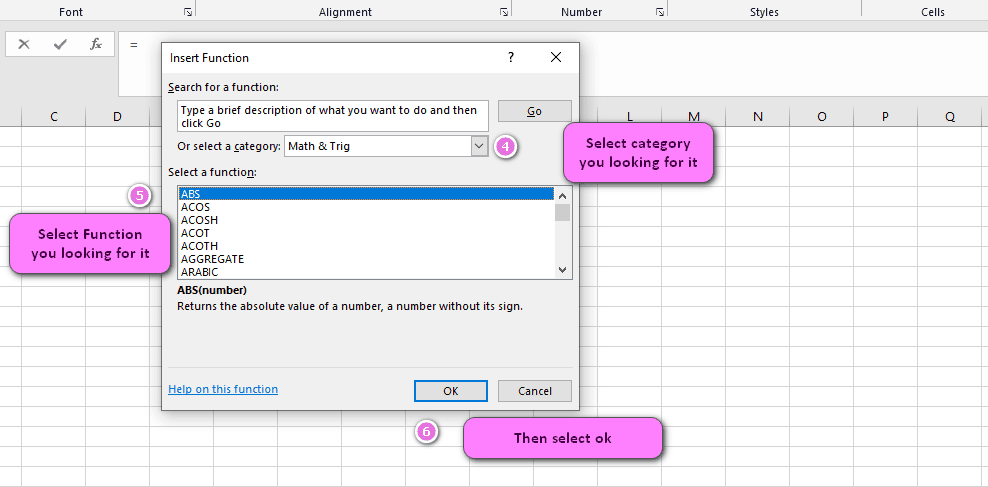
3. In the insert function tab you will see all functions

4. Select math and trig category
5. Select SUMX2MY2 function
6. Then select ok
7. In the function arguments Tab you will see SUMX2MY2 function
8. Array _x section is the first range or array of numbers and can be a number or name, array, or reference that contains numbers
9. Array _y section is the second range or array of numbers and can be a number or name, array, or reference that contains numbers
This function will first multiply the first number by two and then minus the second power of the number waiting for the second row, and finally, get the sum of these values.

10. You will see results in the formula result section
Examples of SUMX2MY2 function in Excel
- Calculating the sum of squares of differences between two sets of data:
=SUMX2MY2(A1:A10,B1:B10)
- Calculating the variance for a set of data:
=SUMX2MY2(A1:A10,AVERAGE(A1:A10))/(COUNT(A1:A10)-1)
- Calculating the standard deviation for a set of data:
=SQRT(SUMX2MY2(A1:A10,AVERAGE(A1:A10))/(COUNT(A1:A10)-1))
- Determining the statistical significance of differences between two sets of data:
=TTEST(A1:A10,B1:B10,2,3)
- Calculating the sum of squares of residuals for a regression analysis:
=SUMX2MY2(A1:A10,B1:B10)
- Calculating the R-squared value for a regression analysis:
=1-((SUMX2MY2(Actual,Predicted))/SUMX2MY2(Actual,AVERAGE(Actual)))
- Calculating the mean squared error (MSE) for a set of data:
=SUMX2MY2(A1:A10,B1:B10)/COUNT(A1:A10)
- Calculating the sum of squares of deviations from the mean for a set of data:
=SUMX2MY2(A1:A10,AVERAGE(A1:A10))
- Calculating the coefficient of variation for a set of data:
=(SQRT(SUMX2MY2(A1:A10,AVERAGE(A1:A10))/(COUNT(A1:A10)-1)))/AVERAGE(A1:A10)
- Assessing the goodness-of-fit of a regression model by calculating the sum of squares of residuals:
=SUMX2MY2(A1:A10,B1:B10)
These are just a few examples of the many applications of the SUMX2MY2 function in Excel.
Example 1:
How to use SUMX2MY2 function in excel
You can see examples of SUMX2MY2 function below:

sumx2my2(A2,B2) ----->>>>answer is  -3

sumx2my2(A3,B3) ----->>>>answer is  -5

sumx2my2(A4,B4) ----->>>>answer is  -7

sumx2my2(A5,B5) ----->>>>answer is  -9

sumx2my2(A6,B6) ----->>>>answer is  -11
Understanding the Excel SUMX2MY2 Function for Data Analysis
The SUMX2MY2 function is an advanced mathematical function in Microsoft Excel that is used for data analysis. It can be used to calculate the sum of squares of differences between two arrays of numbers.
What Does SUMX2MY2 Stand For in Excel and How Does it Work?
SUMX2MY2 stands for “Sum of (X2-Y2).” The function takes two arrays of numbers as its arguments, calculates the difference between each corresponding pair of values, squares those differences, and then adds up all of the squared differences to get the final result.
For example, suppose you have two arrays of numbers:
{1, 2, 3, 4, 5}
{6, 7, 8, 9, 10}
To find the sum of squares of differences between these two arrays using SUMX2MY2, you would use the following formula:
=SUMX2MY2({1, 2, 3, 4, 5}, {6, 7, 8, 9, 10})
This would give you a result of 110.
How to Use the SUMX2MY2 Function in Excel to Calculate the Sum of Squares
To use the SUMX2MY2 function in Excel, you need to provide it with two arrays of numbers as its arguments. The function will then calculate the square of the difference between each corresponding pair of values in the arrays, and add up all of the squared differences to get the final result.
For example, suppose you have two arrays of numbers:
{4, 7, 11, 2, 8}
{1, 3, 9, 5, 4}
To find the sum of squares of differences between these two arrays using SUMX2MY2, you would use the following formula:
=SUMX2MY2({4, 7, 11, 2, 8}, {1, 3, 9, 5, 4})
This would give you a result of 103.
Mastering the Syntax and Arguments of SUMX2MY2 Function in Excel
To use the SUMX2MY2 function in Excel, you need to provide it with two arrays of numbers as its arguments. The syntax for the function is as follows:
SUMX2MY2(array_x, array_y)
Here, array_x and array_y are the arrays of numbers for which you want to calculate the sum of squares of differences.
A Step-by-Step Guide to Using SUMX2MY2 Function in Excel Formulas
To use the SUMX2MY2 function in Excel formulas, follow these steps:
- Open a new or existing Excel worksheet.
- Select the cell where you want to display the result of the function.
- Type the following formula into the cell:
=SUMX2MY2(array_x, array_y), replacingarray_xandarray_ywith the actual arrays of numbers that you want to use. - Press Enter to calculate the result of the function.
- The cell will now display the result of the function.
Exploring the Use of SUMX2MY2 Function with Arrays in Excel
The SUMX2MY2 function is a powerful tool for comparing two sets of data in Microsoft Excel. It allows you to calculate the sum of squares of differences between corresponding values in two arrays.
For example, suppose you have the following two sets of data:
{1, 3, 5, 7, 9}
{2, 4, 6, 8, 10}
To find the sum of squares of differences between these two arrays using SUMX2MY2, you would use the following formula:
=SUMX2MY2({1, 3, 5, 7, 9}, {2, 4, 6, 8, 10})
This would give you a result of 20.
The Proper Syntax and Purpose of SUMX2MY2 Function in Excel
The proper syntax for the SUMX2MY2 function in Excel is as follows:
=SUMX2MY2(array_x, array_y)
Here, array_x and array_y are the two arrays of numbers for which you want to calculate the sum of squares of differences. The function returns the sum of squares of the differences between corresponding values in the two arrays.
The purpose of the SUMX2MY2 function is to help you compare two sets of data and determine whether they are statistically significant. It can also be used to calculate the sum of squares of residuals in regression analysis, and to assess the goodness-of-fit of a regression model.
Advantages of Using SUMX2MY2 Function for Statistical Analysis in Excel
The SUMX2MY2 function has several advantages when it comes to statistical analysis in Microsoft Excel. For one, it allows you to easily compare two sets of data and determine whether they are statistically significant. It is also a powerful tool for calculating the sum of squares of residuals in regression analysis, which can help you assess the accuracy of your model.
Another advantage of using the SUMX2MY2 function is that it is easy to use and understand. Even if you have no prior experience with statistical analysis, you can quickly learn how to use this function in Excel.
Comparison Between SUMX2MY2 and SUMX2PY2 Functions in Excel
The SUMX2MY2 and SUMX2PY2 functions in Excel are both used for comparing two sets of data. However, there are some key differences between them.
The SUMX2MY2 function calculates the sum of squares of the differences between corresponding values in two arrays. The SUMX2PY2 function, on the other hand, calculates the sum of squares of the sums of corresponding values in two arrays.
For example, suppose you have the following two arrays:
{1, 3, 5, 7, 9}
{2, 4, 6, 8, 10}
To find the sum of squares of the differences between these two arrays using SUMX2MY2, you would use the following formula:
=SUMX2MY2({1, 3, 5, 7, 9}, {2, 4, 6, 8, 10})
This would give you a result of 20.
To find the sum of squares of the sums of these two arrays using SUMX2PY2, you would use the following formula:
=SUMX2PY2({1, 3, 5, 7, 9}, {2, 4, 6, 8, 10})
This would give you a result of 110.
Calculating the Sum of Squares of Differences in Excel with SUMX2MY2 Function
To calculate the sum of squares of differences between two sets of data using the SUMX2MY2 function in Excel, you need to provide it with two arrays of numbers as its arguments. The function will then calculate the square of the difference between each corresponding pair of values in the arrays, and add up all of the squared differences to get the final result.
For example, suppose you have two sets of data as follows:
{4, 7, 11, 2, 8}
{1, 3, 9, 5, 4}
To find the sum of squares of differences between these two arrays using SUMX2MY2, you would use the following formula:
=SUMX2MY2({4, 7, 11, 2, 8}, {1, 3, 9, 5, 4})
This would give you a result of 103.
Using SUMX2MY2 Function to Calculate Deviation in Excel – A Comprehensive Guide
The SUMX2MY2 function is a powerful tool for calculating deviation in Microsoft Excel. It can be used to determine the difference between two sets of data and assess whether they are statistically significant.
To use the SUMX2MY2 function to calculate deviation in Excel, you need to provide it with two arrays of numbers as its arguments. The function will then calculate the square of the difference between each corresponding pair of values in the arrays, and add up all of the squared differences to get the final result.
For example, suppose you have the following two sets of data:
{1, 3, 5, 7, 9}
{2, 4, 6, 8, 10}
To find the deviation between these two sets of data using SUMX2MY2, you would use the following formula:
=SUMX2MY2({1, 3, 5, 7, 9}, {2, 4, 6, 8, 10})
This would give you a result of 20.
Understanding Correlation Coefficient Calculation with SUMX2MY2 Function in Excel
The correlation coefficient is a measure of the strength and direction of a linear relationship between two sets of data. It can be calculated using the SUMX2MY2 function in Microsoft Excel.
To calculate the correlation coefficient using the SUMX2MY2 function, you first need to calculate the sum of squares of deviations for each set of data. You can then use the following formula:
correlation_coefficient = COVAR(array_x, array_y) / (STDEV.P(array_x) * STDEV.P(array_y))
Here, array_x and array_y are the two arrays of numbers for which you want to calculate the correlation coefficient. COVAR is a function in Excel that calculates the covariance between two sets of data, and STDEV.P is a function that calculates the standard deviation for a population.
For example, suppose you have the following two sets of data:
{1, 3, 5, 7, 9}
{2, 4, 6, 8, 10}
To calculate the correlation coefficient between these two sets of data using the SUMX2MY2 function, you would use the following formula:
=COVAR({1, 3, 5, 7, 9}, {2, 4, 6, 8, 10}) / (STDEV.P({1, 3, 5, 7, 9}) * STDEV.P({2, 4, 6, 8, 10}))
This would give you a result of 1, indicating a perfect positive correlation between the two sets of data.
Practical Examples of Using SUMX2MY2 Function in Excel for Effective Data Analysis
The SUMX2MY2 function can be used in a variety of ways for effective data analysis in Microsoft Excel. Here are a few practical examples:
- Comparing the performance of different products in a sales dataset by calculating the sum of squares of differences between their sales figures.
- Analyzing the accuracy of a forecasting model by calculating the sum of squares of residuals using actual vs. predicted values.
- Determining the impact of different advertising channels on leads generated by a marketing campaign by comparing the sum of squares of differences between the number of leads generated by each channel.
In each of these examples, the SUMX2MY2 function is used to compare two sets of data and determine whether they are statistically significant.
Important Considerations When Using SUMX2MY2 Function with Multiple Arguments in Excel
When using the SUMX2MY2 function with multiple arguments in Microsoft Excel, there are a few important considerations to keep in mind. These include:
- Ensuring that the arrays of numbers you provide as arguments have the same number of elements.
- Being careful when using SUMX2MY2 with large datasets, as it can be computationally intensive and slow down your calculations.
- Avoiding common errors such as mistyping array names or forgetting to close parentheses in your formulas.
By keeping these considerations in mind, you can use the SUMX2MY2 function effectively in your Excel worksheets.
Avoiding Common Errors and Mistakes When Using SUMX2MY2 Function in Excel
When using the SUMX2MY2 function in Microsoft Excel, there are several common errors and mistakes that you should be aware of. These can include:
- Forgetting to close parentheses in your formulas, causing them to return an error.
- Mistyping array names or using incorrect syntax for the function, which can also cause errors.
- Using SUMX2MY2 with arrays of different sizes
How to Deal with Empty Cells or Text Values When Using SUMX2MY2 Function in Excel
When using the SUMX2MY2 function in Microsoft Excel, it is important to handle empty cells or text values properly. These can cause errors or inaccurate results when calculating the sum of squares of differences between two sets of data.
One way to deal with empty cells or text values is to use the IFERROR function to replace them with a default value. For example, you could use the following formula to calculate the sum of squares of differences between two sets of data, replacing any empty cells with a default value of 0:
=SUMX2MY2(IFERROR(array_x, 0), IFERROR(array_y, 0))
This will ensure that the SUMX2MY2 function returns a valid result even if there are empty cells or text values in your arrays of numbers.
Filtering and Criteria Usage with SUMX2MY2 Function in Excel – Best Practices
When using the SUMX2MY2 function in Microsoft Excel, it is important to use filtering and criteria effectively to get accurate results. This can be especially important when analyzing large datasets with complex relationships between different variables.
One best practice for using filtering and criteria with SUMX2MY2 is to define clear criteria for selecting data points from your arrays. For example, if you are comparing the performance of different products in a sales dataset, you might filter your arrays based on product type or geography to ensure that you are only comparing relevant data points.
Another best practice is to use conditional formatting or other visual aids to help you identify patterns or outliers in your data. This can make it easier to interpret the results of your calculations and identify areas where further analysis may be needed.
Can Non-Numeric Data be Used with SUMX2MY2 Function in Excel?
No, non-numeric data cannot be used with the SUMX2MY2 function in Microsoft Excel. This function is designed specifically to calculate the sum of squares of differences between two sets of numeric data, and will return an error if non-numeric data is included in your arrays.
If you need to compare sets of non-numeric data in Excel, you may want to consider using a different function or approach depending on your specific needs. For example, you might use the COUNTIF function to count the number of occurrences of different values in your arrays, or use pivot tables to summarize your data and identify patterns or trends.
Common Mistakes to Avoid When Using SUMX2MY2 Function in Excel for Accurate Results
When using the SUMX2MY2 function in Microsoft Excel, there are several common mistakes that you should be aware of to ensure accurate results. These include:
- Forgetting to close parentheses in your formulas, causing them to return an error.
- Mistyping array names or using incorrect syntax for the function, which can also cause errors.
- Failing to properly handle empty cells or non-numeric data in your arrays, leading to inaccurate results.
- Using SUMX2MY2 with arrays of different sizes or without properly aligning corresponding values.
By avoiding these common mistakes and following best practices for using the SUMX2MY2 function, you can ensure accurate and reliable results in your Excel worksheets.
Exploring Alternative Functions to SUMX2MY2 in Excel for Data Analysis
While the SUMX2MY2 function is a powerful tool for comparing two sets of data in Microsoft Excel, there are several alternative functions that can also be useful for data analysis. These include:
- SUMX2PY2, which calculates the sum of squares of the sums of corresponding values in two arrays.
- COVAR, which calculates the covariance between two sets of data.
- CORREL, which calculates the correlation coefficient between two sets of data.
Each of these functions has its own strengths and weaknesses depending on the specific needs of your analysis. By exploring different functions and approaches to data analysis in Excel, you can find the tools that work best for your unique situation.
