What is SUMXMY2 function in Excel?
The SUMXMY2 function is one of the math functions of Excel.
It Sums the squares of the differences in two corresponding ranges or arrays.
We can find this function in Math & trig category of insert function Tab.
How to use SUMXMY2 function in excel
- Click on an empty cell (like F5 )

2. Click on fx icon (or press shift+F3)

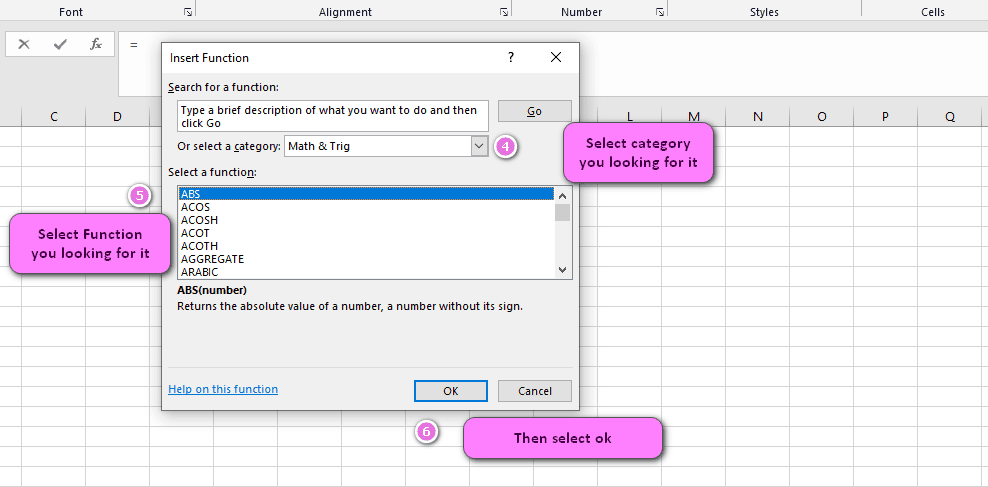
3. In the insert function tab you will see all functions

4. Select math and trig category
5. Select SUMXMY2 function
6. Then select ok
7. In the function arguments Tab you will see SUMXMY2 function.
8. Array _x section is the first range or array of values and can be a number or name, array, or reference that contains numbers
9. Array _y section is the second range or array of values and can be a number or name, array, or reference that contains numbers
10. This function returns the sum of squares of the difference between the corresponding values in the two arrays
11. You will see results in the formula result section

Examples of SUMXMY2 function in Excel
- Compare two sets of data and calculate the sum of squares of the differences:
=SUMXMY2(A1:A10,B1:B10)
- Calculate the variance of a set of data using the SUMXMY2 function:
=SUMXMY2(A1:A10,AVERAGE(A1:A10))/(COUNT(A1:A10)-1)
- Calculate the mean squared error between two sets of data:
=SUMXMY2(A1:A10,B1:B10)/COUNT(A1:A10)
- Determine the difference between two sets of forecasted data:
=SUMXMY2(Forecast1,Forecast2)
- Find the sum of squares of deviations from a regression line:
=SUMXMY2(ActualData,RegressionLine)
- Create a formula that compares two lists of numbers and returns only the absolute differences between them:
=SUM(ABS(SUMXMY2(List1,List2)))
- Calculate the total deviations of actual sales from forecasted sales for a given period:
=SUMXMY2(ActualSales, ForecastedSales)
- Compute the residual sum of squares (RSS) for a set of data:
=SUMXMY2(A1:A10, B1:B10)
- Determine the level of fit between predicted values and actual values by calculating the goodness-of-fit coefficient:
=1-((SUMXMY2(Actual,Predicted))/SUMX2MY2(Actual,AVERAGE(Actual)))
- Compare two sets of data and determine if the differences are statistically significant by using a t-test:
=TTEST(A1:A10,B1:B10,2,3)
Example 1:
How to use SUMXMY2 function in excel
You can see examples of SUMXMY2 function below:

sumxmy2(A2,B2) ----->>>>answer is  4

sumxmy2(A3,B3) ----->>>>answer is  4

sumxmy2(A4,B4) ----->>>>answer is  9

sumxmy2(A5,B5) ----->>>>answer is  9

sumxmy2(A6,B6) ----->>>>answer is  25
“Excel’s SUMXMY2 Function: A Powerful Tool for Data Comparison”
Excel’s SUMXMY2 function is a powerful tool for comparing two sets of data. By calculating the sum of squares of differences between corresponding values in two arrays, the SUMXMY2 function can quickly identify patterns and trends in the data.
For example, suppose you have two sets of data in cells A1:A10 and B1:B10. You can use the SUMXMY2 function to calculate the sum of squares of differences between the two sets of data with the following formula:
=SUMXMY2(A1:A10,B1:B10)
This will give you the sum of squares of differences between each pair of corresponding numbers in the two sets of data.
“Understanding the Inner Workings of Excel’s SUMXMY2 Function”
To understand how Excel’s SUMXMY2 function works, it’s important to know that it calculates the sum of squares of differences between corresponding values in two arrays. The function takes two arrays as its arguments and returns the sum of squares of the differences.
For example, suppose you have two sets of data in cells A1:A10 and B1:B10. To use the SUMXMY2 function to compare these two sets of data, you would use the following formula:
=SUMXMY2(A1:A10,B1:B10)
This formula would calculate the sum of squares of differences between each pair of corresponding numbers in the two sets of data.
“Mastering the Syntax of Excel’s SUMXMY2 Function for Efficient Data Analysis”
The syntax of Excel’s SUMXMY2 function is straightforward. It takes two arrays as arguments and returns the sum of squares of differences between corresponding values in the two arrays.
The syntax of the SUMXMY2 function looks like this:
=SUMXMY2(array1, array2)
For example, suppose you have two sets of data in cells A1:A10 and B1:B10. To use the SUMXMY2 function to compare these two sets of data, you would use the following formula:
=SUMXMY2(A1:A10,B1:B10)
This formula would calculate the sum of squares of differences between each pair of corresponding numbers in the two sets of data.
“Avoiding Errors in Excel’s SUMXMY2 Function: Using Numeric Values Only”
To avoid errors when using Excel’s SUMXMY2 function, it’s important to use numeric values only. Non-numeric values such as text or logical values will cause errors.
For example, suppose you have two sets of data in cells A1:A10 and B1:B10, but one of the cells in A5 contains the text “N/A”. If you try to use the SUMXMY2 function to compare these two sets of data, you may get an error message. To avoid this error, make sure that all cells in the arrays contain numeric values.
“Comparing Datasets Made Easy with Excel’s SUMXMY2 Function”
Excel’s SUMXMY2 function makes it easy to compare two sets of data by calculating the sum of squares of differences between corresponding values in the two arrays.
For example, suppose you have two sets of data in cells A1:A10 and B1:B10. You can use the SUMXMY2 function to calculate the sum of squares of differences between the two sets of data with the following formula:
=SUMXMY2(A1:A10,B1:B10)
This formula would give you the sum of squares of differences between each pair of corresponding numbers in the two sets of data, which can help you identify patterns and trends in the data.
Calculating Squared Differences in Excel: A Guide to the SUMXMY2 Function”
Excel’s SUMXMY2 function is a useful tool for calculating the squared differences between two sets of data. The function takes two arrays as inputs and returns the sum of squares of differences between corresponding values in the arrays.
For example, suppose you have two sets of data in cells A1:A10 and B1:B10. You can use the SUMXMY2 function to calculate the sum of squares of differences between the two sets of data with the following formula:
=SUMXMY2(A1:A10,B1:B10)
This will give you the sum of squares of differences between each pair of corresponding numbers in the two sets of data.
“Using Excel’s SUMXMY2 Function for Regression Analysis: Exploring R-Squared”
The R-squared or coefficient of determination is a measure of how well a regression line fits the data. Excel’s SUMXMY2 function can be used to calculate the sum of squares of residuals, which is an important component of the R-squared calculation.
For example, suppose you have a set of actual data in cells A1:A10 and predicted data in cells B1:B10. You can use the SUMXMY2 function to calculate the sum of squares of residuals with the following formula:
=SUMXMY2(A1:A10,B1:B10)
To calculate the R-squared value, you can divide the sum of squares of residuals by the total sum of squares of the actual data using the following formula:
=1-((SUMXMY2(Actual,Predicted))/SUMX2MY2(Actual,AVERAGE(Actual)))
“Calculating Residuals in Excel with the SUMXMY2 Function”
Residuals are the differences between the actual values and the predicted values in a regression analysis. Excel’s SUMXMY2 function can be used to calculate the sum of squares of residuals, which is a useful metric for measuring how well a regression line fits the data.
For example, suppose you have a set of actual data in cells A1:A10 and predicted data in cells B1:B10. You can use the SUMXMY2 function to calculate the sum of squares of residuals with the following formula:
=SUMXMY2(A1:A10,B1:B10)
This will give you the sum of squares of differences between each pair of corresponding numbers in the two sets of data, which can then be used to calculate the residuals.
“Performing t-tests in Excel with the SUMXMY2 Function”
Excel’s SUMXMY2 function can also be used to perform t-tests in Excel. A t-test is a statistical test used to determine whether there is a significant difference between two sets of data.
For example, suppose you have two sets of data in cells A1:A10 and B1:B10. You can use the SUMXMY2 function to perform a t-test with the following formula:
=TTEST(A1:A10,B1:B10,2,3)
The first argument of the TTEST function specifies the first range of data, the second argument specifies the second range of data, and the third and fourth arguments specify the type of t-test to perform.
“How to Calculate Mean Squared Error (MSE) using Excel’s SUMXMY2 Function”
Mean squared error (MSE) is another important metric in regression analysis that can be calculated using Excel’s SUMXMY2 function. MSE measures the average of the squared differences between predicted values and actual values.
For example, suppose you have a set of actual data in cells A1:A10 and predicted data in cells B1:B10. You can use the SUMXMY2 function to calculate the mean squared error with the following formula:
=SUMXMY2(A1:A10,B1:B10)/COUNT(A1:A10)
Excel’s SUMXMY2 and SUMX2MY2 Functions: Understanding the Difference”
While Excel’s SUMXMY2 and SUMX2MY2 functions may seem similar, there is a difference between them. The SUMXMY2 function calculates the sum of squares of differences between corresponding values in two arrays, while the SUMX2MY2 function calculates the sum of squares of differences between corresponding values squared in two arrays.
For example, suppose you have two sets of data in cells A1:A10 and B1:B10. To use the SUMXMY2 function to compare these two sets of data, you would use the following formula:
=SUMXMY2(A1:A10,B1:B10)
This formula would calculate the sum of squares of differences between each pair of corresponding numbers in the two sets of data.
On the other hand, to use the SUMX2MY2 function to compare these two sets of data, you would use the following formula:
=SUMX2MY2(A1:A10,B1:B10)
This formula would calculate the sum of squares of square differences between each pair of corresponding numbers in the two sets of data.
“Measuring Goodness-of-Fit in Excel: Using the SUMXMY2 Function”
The SUMXMY2 function can also be used to measure the goodness-of-fit of a regression model. By calculating the sum of squares of residuals, which are the differences between the actual values and the predicted values, you can determine how well your model fits the data.
For example, suppose you have a set of actual data in cells A1:A10 and predicted data in cells B1:B10. You can use the SUMXMY2 function to calculate the sum of squares of residuals with the following formula:
=SUMXMY2(A1:A10,B1:B10)
You can then use this value to calculate other goodness-of-fit metrics such as the R-squared value.
“Calculating Variance with Excel’s SUMXMY2 Function: A Comprehensive Guide”
Excel’s SUMXMY2 function can also be used to calculate the variance of a dataset. To do this, you must first calculate the mean of the dataset, and then use the SUMXMY2 function to calculate the sum of squares of differences between each data point and the mean. By dividing this value by the sample size minus one, you can obtain the variance.
For example, suppose you have a set of data in cells A1:A10. You can use the following formula to calculate the variance of the dataset:
=SUMXMY2(A1:A10,AVERAGE(A1:A10))/(COUNT(A1:A10)-1)
This will give you the variance of the dataset.
“Predictive Analytics Made Easy with Excel’s SUMXMY2 Function”
Excel’s SUMXMY2 function is a powerful tool for predictive analytics. By comparing actual data with predicted data, you can measure the accuracy of your predictive models and identify areas for improvement.
For example, suppose you have a set of actual data in cells A1:A10 and predicted data in cells B1:B10. You can use the SUMXMY2 function to calculate the sum of squares of residuals with the following formula:
=SUMXMY2(A1:A10,B1:B10)
You can then use this value to calculate other metrics such as the mean squared error or the R-squared value to evaluate the accuracy of your predictive model.
“Dynamic Range Calculations in Excel with the SUMXMY2 Function”
Excel’s SUMXMY2 function can also be used with dynamic ranges. Dynamic ranges allow you to automatically expand or contract the range of cells used in a calculation based on the number of values in the range.
For example, suppose you have a set of data in cells A1:A10, and you want to use the SUMXMY2 function to calculate the sum of squares of differences between each pair of corresponding numbers in the range. You can use a dynamic range by using the following formula:
=SUMXMY2(A1:INDEX(A:A,COUNT(A:A)),B1:INDEX(B:B,COUNT(B:B)))
The Limitations of Excel’s SUMXMY2 Function: What You Need to Know”
While Excel’s SUMXMY2 function is a powerful tool for comparing and analyzing data, it does have some limitations. One limitation is that the function can only compare two sets of data with the same number of values. If your arrays have different numbers of values, you will need to adjust the calculation accordingly.
Another limitation is that the function does not account for outliers or extreme values in the data. Outliers can significantly affect the results of the calculation, so it is important to identify and remove them before using the SUMXMY2 function.
For example, suppose you have two sets of data in cells A1:A10 and B1:B11. The second set of data has one extra value compared to the first set. In this case, you could adjust the calculation by excluding the last value in the second set of data:
=SUMXMY2(A1:A10,B1:B10)
“Determining Statistical Significance with Excel’s SUMXMY2 Function”
Excel’s SUMXMY2 function can also be used to determine the statistical significance of differences between two sets of data. By performing a t-test on the sum of squares of differences, you can determine whether the differences between the two sets of data are statistically significant.
For example, suppose you have two sets of data in cells A1:A10 and B1:B10. You can use the SUMXMY2 function to calculate the sum of squares of differences between the two sets of data with the following formula:
=SUMXMY2(A1:A10,B1:B10)
You can then perform a t-test on this value to determine whether the differences are statistically significant.
“Excel’s SUMSQ vs. SUMXMY2 Functions: Which One Should You Use?”
While both Excel’s SUMSQ and SUMXMY2 functions can be used to calculate the sum of squares of deviations between two sets of data, there is a difference between them. The SUMSQ function calculates the sum of squares of deviations from the mean, while the SUMXMY2 function calculates the sum of squares of differences between corresponding values in two arrays.
Which one you should use depends on what you are trying to accomplish. If you want to measure how much each value in a dataset deviates from the mean, then the SUMSQ function would be more appropriate. On the other hand, if you want to compare two sets of data directly, then the SUMXMY2 function would be more appropriate.
For example, suppose you have a set of data in cells A1:A10 and you want to calculate the sum of squares of deviations from the mean. You could use the following formula:
=SUMSQ(A1:A10-AVERAGE(A1:A10))
“Squaring Deviations in Excel: Using the SUMXMY2 Function”
Excel’s SUMXMY2 function can also be used to square deviations in a dataset. By calculating the sum of squares of differences between each data point and the mean, you can obtain a measure of how much each value in the dataset varies from the mean.
For example, suppose you have a set of data in cells A1:A10 and you want to calculate the sum of squares of deviations from the mean. You can use the following formula:
=SUMXMY2(A1:A10,AVERAGE(A1:A10))
This will give you the sum of squares of differences between each data point and the mean.
“Dealing with Missing Values in Excel’s SUMXMY2 Function”
If your datasets contain missing values, Excel’s SUMXMY2 function may return an error. To deal with missing values, you can either remove them from the datasets or replace them with a placeholder value such as zero or the average of the remaining values.
For example, suppose you have two sets of data in cells A1:A10 and B1:B10, but one value is missing from the second set of data. You can replace the missing value with the average of the remaining values using the following formula:
=SUMXMY2(A1:A10,B1:B10+(AVERAGE(B1:B9)-B11))
