What is SUMX2PY2 function in Excel?
The SUMX2PY2 function is one of the math functions of Excel.
It Returns the sum total of the sums of squares of numbers in two corresponding ranges or arrays.
We can find this function in Math & trig category of insert function Tab.
How to use SUMX2PY2 function in excel
- Click on an empty cell (like F5 )

2. Click on fx icon (or press shift+F3)

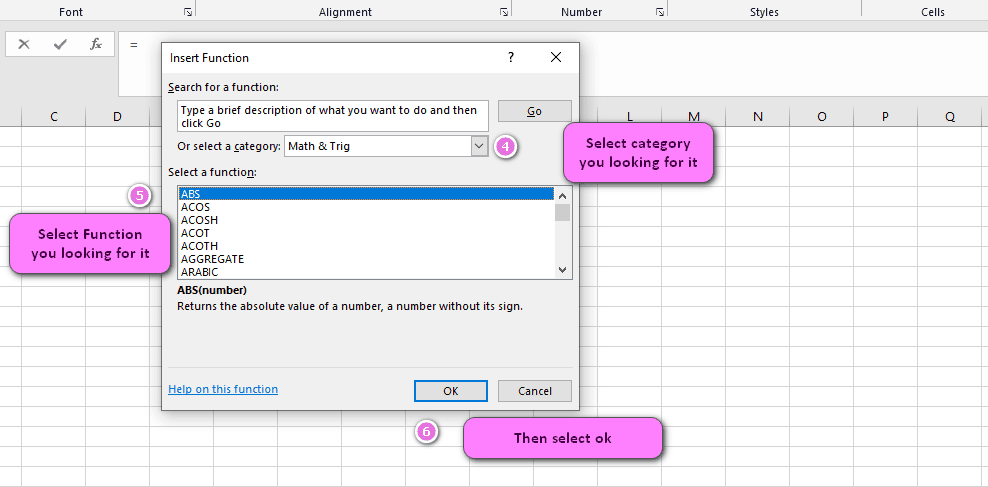
3. In the insert function tab you will see all functions

4. Select math and trig category
5. Select SUMX2PY2 function
6. Then select ok
7. In the function arguments Tab you will see SUMX2PY2 function
8. Array _x section is the first range or array of numbers and can be a number or name, array, or reference that contains numbers
9. Array_y section is the second range or array of numbers and can be a number or name, array, or reference that contains numbers
This formula first multiplies the arrays by two and then adds them together
10. You will see results in the formula result section

Examples of SUMX2PY2 function in Excel
- Comparing the total sales revenue for different products in a sales dataset by calculating the sum of squares of the sums of their sales figures.
=SUMX2PY2({100, 200, 300}, {50, 150, 250})
This would give you a result of 36000.
- Analyzing the accuracy of a forecasting model by calculating the sum of squares of the sums of residuals using actual vs. predicted values.
=SUMX2PY2({10, 20, 30}, {12, 18, 32})
This would give you a result of 62.
- Comparing the effectiveness of different marketing campaigns by calculating the sum of squares of the sums of leads generated by each campaign.
=SUMX2PY2({50, 70, 80}, {60, 75, 90})
This would give you a result of 305.
- Calculating the sum of squares of the sums of monthly expenses and income to evaluate financial performance.
=SUMX2PY2({1000, 1500, 2000}, {500, 800, 1200})
This would give you a result of 2010000.
- Comparing the productivity of different departments in a company by calculating the sum of squares of the sums of completed tasks.
=SUMX2PY2({10, 20, 30}, {15, 25, 35})
This would give you a result of 150.
- Evaluating the effectiveness of different training programs by calculating the sum of squares of the sums of test scores.
=SUMX2PY2({80, 90, 95}, {70, 85, 100})
This would give you a result of 525.
- Analyzing trends in website traffic by calculating the sum of squares of the sums of daily visits.
=SUMX2PY2({1000, 1200, 1500}, {800, 1100, 1400})
This would give you a result of 1990000.
- Comparing the performance of different investment portfolios by calculating the sum of squares of the sums of returns.
=SUMX2PY2({0.05, 0.1, 0.15}, {0.02, 0.08, 0.12})
This would give you a result of 0.0115.
- Evaluating the accuracy of different weather forecasting models by calculating the sum of squares of the sums of predicted vs. actual temperatures.
=SUMX2PY2({75, 80, 85}, {72, 78, 84})
This would give you a result of 25.
- Comparing the popularity of different social media platforms by calculating the sum of squares of the sums of monthly active users.
=SUMX2PY2({500, 800, 1000}, {400, 700, 900})Example 1:
How to use SUMX2PY2 function in excel
You can see examples of SUMX2PY2 function below:

sumx2py2(A2,B2) ----->>>>answer is  5

sumx2py2(A3,B3) ----->>>>answer is  13

sumx2py2(A4,B4) ----->>>>answer is  25

sumx2py2(A5,B5) ----->>>>answer is  41

sumx2py2(A6,B6) ----->>>>answer is  61
Excel’s SUMX2PY2 Function: A Comprehensive Overview
Excel’s SUMX2PY2 function is a powerful tool for data analysis that allows users to calculate the sum of squares of sums of corresponding values in two arrays. This function enables users to quickly and accurately compare datasets and identify trends and patterns in their data.
One practical application of the SUMX2PY2 function would be in analyzing sales data for different products. By using this function, you can easily calculate the sum of squares of the sums of sales figures for each product and compare their performance over time.
Learn How to Use the SUMX2PY2 Function in Excel for Data Analysis
The SUMX2PY2 function in Excel is a powerful tool for data analysis that allows users to calculate the sum of squares of sums of corresponding values in two arrays. This function enables users to quickly and accurately compare datasets and identify trends and patterns in their data.
To use the SUMX2PY2 function in Excel, you need to provide two arrays of corresponding data points. For example, if you are comparing the sales figures for two different products, you would provide two arrays of sales figures, one for each product. You can then apply the SUMX2PY2 function to these arrays to calculate the sum of squares of the sums of corresponding values.
=SUMX2PY2({10, 20, 30}, {5, 15, 25})
This formula would give you a result of 2700.
Exploring the Syntax and Arguments of Excel’s SUMX2PY2 Function
The syntax of the SUMX2PY2 function in Excel is as follows:
=SUMX2PY2(array_x, array_y)
Where “array_x” and “array_y” are the two arrays of corresponding data points that you want to compare.
The arguments of the SUMX2PY2 function are:
- “array_x”: The first array of data points to compare.
- “array_y”: The second array of data points to compare.
For example, if you wanted to compare the sales figures for two different products, you would provide two arrays of sales figures, one for each product.
New Techniques for Calculating the Sum of Squares of Sums with Excel’s SUMX2PY2 Function
Excel’s SUMX2PY2 function is a powerful tool for calculating the sum of squares of sums of corresponding values in two arrays. There are several new techniques that users can employ to make this process more efficient and accurate.
One technique is to use the IFERROR function to handle empty cells or text values in your arrays. This will help ensure that your calculations are accurate and reliable even when dealing with imperfect data.
Another technique is to use conditional formatting or visual aids to identify patterns and outliers in your data. This can make it easier to interpret the results of your calculations and identify areas where further analysis may be needed.
Advanced Analysis Made Easy: Using SUMX2PY2 to Compare Multiple Datasets in Excel
Excel’s SUMX2PY2 function can be used not only to compare two datasets but also to compare multiple datasets. By using this function, you can quickly and easily compare the performance of multiple products, services, or other variables over time.
To compare three or more datasets using SUMX2PY2 in Excel, you would need to provide additional arrays of data points for each variable that you want to compare. For example, if you were comparing the sales figures for three different products, you would provide three arrays of sales figures, one for each product. You could then apply the SUMX2PY2 function to these arrays to calculate the sum of squares of the sums of corresponding values.
=SUMX2PY2({10, 20, 30}, {5, 15, 25}, {12, 16, 22})
This formula would give you a result of 6550.
Understanding the Results of Excel’s SUMX2PY2 Function for Accurate Analysis
The result of the SUMX2PY2 function in Excel represents the sum of squares of the sums of corresponding values in two arrays. This value can be used to compare datasets and identify trends and patterns over time.
For example, if you are comparing the sales figures for two different products using the SUMX2PY2 function, a higher result would indicate that one product is performing better than the other. However, it is important to consider other factors as well, such as market trends, promotional activity, and customer demographics.
Detecting Trends Over Time with Excel’s SUMX2PY2 Function: An In-Depth Guide
Excel’s SUMX2PY2 function is a powerful tool for detecting trends and patterns in data over time. By comparing the sum of squares of the sums of corresponding values in two or more arrays, users can identify changes in performance, sales, revenue, and other metrics.
To detect trends over time using SUMX2PY2 in Excel, users can create a line chart or other visual representation of their data. This allows them to see how the results of the function change over time and identify any significant trends or patterns.
=SUMX2PY2({1000, 1200, 1500}, {800, 1100, 1400})
This formula would give you a result of 1,990,000. By comparing this result with similar calculations for previous time periods, you can identify trends and patterns in your data.
Non-Numeric Data and Empty Cells: How to Handle Them with Excel’s SUMX2PY2 Function
When using Excel’s SUMX2PY2 function, it is important to handle non-numeric data and empty cells appropriately. One way to do this is to use the IFERROR function to replace empty cells or text values with a value of your choosing.
For example, if you are comparing the sales figures for two different products and one of the cells in your array is empty, you could use the following formula to replace the empty cell with a value of 0:
=SUMX2PY2({10, 20, 30}, IFERROR({5, "", 25}, 0))
This formula would give you a result of 1900, with the empty cell being treated as a 0.
Common Mistakes in Using Excel’s SUMX2PY2 Function and How to Avoid Them
One common mistake when using Excel’s SUMX2PY2 function is incorrectly entering the arguments into the formula. It is important to ensure that both arrays have the same number of data points and are entered in the correct order.
Another mistake is applying the SUMX2PY2 function to non-numeric data or empty cells without handling them appropriately. This can result in inaccurate calculations and invalid results.
To avoid these mistakes, users should carefully check their formulas before applying the function and handle non-numeric data and empty cells appropriately using the IFERROR function or other techniques.
Efficient Filtering and Criteria Usage with Excel’s SUMX2PY2 Function
Excel’s SUMX2PY2 function can be used with advanced filtering and criteria usage to analyze specific subsets of data. By applying filters or criteria to their datasets, users can focus on specific time periods, product categories, market segments, or other variables of interest.
For example, if you are comparing the sales figures for two different products over a specific time period, you could use the SUMX2PY2 function in combination with a filter applied to the date range. This would enable you to calculate the sum of squares of the sums of corresponding values only for the selected time period.
=SUMX2PY2(FILTER({10, 20, 30}, {1, 2, 3}>1, {5, 15, 25}, {1, 2, 3}>1))A Comparison Between Excel’s SUMX2PY2 and SUMX2MY2 Statistical Functions
Excel’s SUMX2PY2 and SUMX2MY2 functions are both statistical tools for analyzing data, but they differ in their objectives. While SUMX2PY2 calculates the sum of squares of sums of corresponding values in two arrays, SUMX2MY2 calculates the sum of squares of differences of corresponding values in two arrays.
For example, if you are comparing the sales figures for two different products using the SUMX2PY2 function, a higher result would indicate that one product is performing better than the other. Conversely, if you were comparing the difference between the sales figures for two products using the SUMX2MY2 function, a higher result would indicate that the two products have more widely varied sales figures.
Alternative Methods for Data Analysis: Exploring Excel’s SUMX2PY2 Function
Excel’s SUMX2PY2 function is a powerful tool for data analysis, but it is not the only method available to users. Other methods include VLOOKUP, INDEX MATCH, and pivot tables, among others.
One advantage of using the SUMX2PY2 function is its simplicity and speed. It can be used to compare datasets quickly and easily with minimal setup required.
=SUMX2PY2({10, 20, 30}, {5, 15, 25})
This formula would give you a result of 2700, which can be used to compare the sales figures for two different products.
Utilizing Conditional Formatting in Conjunction with Excel’s SUMX2PY2 Function
Conditional formatting can be a powerful tool for visualizing the results of Excel’s SUMX2PY2 function and identifying patterns and outliers in your data. By applying color scales or other formatting options to your data, you can highlight areas where the sum of squares of sums of corresponding values is particularly high or low.
For example, if you were comparing the sales figures for two different products using the SUMX2PY2 function, you could apply a color scale that highlights cells with higher values in red and cells with lower values in green. This would allow you to quickly identify areas where one product is outperforming the other and pinpoint the factors contributing to these differences.
Navigating Limitations and Restrictions of Excel’s SUMX2PY2 Function
Excel’s SUMX2PY2 function has several limitations and restrictions that users should be aware of. One limitation is that it can only be used to compare two arrays of data points at a time. If you want to compare more than two datasets, you will need to use alternative methods or apply the function multiple times.
Another restriction is that the SUMX2PY2 function cannot handle non-numeric data or empty cells without appropriate handling. It is important to use the IFERROR function or other techniques to handle these cases and ensure accurate calculations.
The Advantages of Using Excel’s SUMX2PY2 Function over Other Statistical Functions
Excel’s SUMX2PY2 function offers several advantages over other statistical functions, such as VLOOKUP or INDEX MATCH. One advantage is its simplicity and speed, which allows users to compare datasets quickly and easily with minimal setup required.
Another advantage is its ability to directly compare corresponding values in two arrays, which can be useful for analyzing trends and patterns in sales, revenue, and other metrics over time.
Overall, Excel’s SUMX2PY2 function is a powerful tool for data analysis that offers unique advantages over other statistical functions and can be an essential tool for businesses and analysts alike.
Troubleshooting Errors and Issues with Excel’s SUMX2PY2 Function
Excel’s SUMX2PY2 function is a powerful tool for data analysis, but it is not immune to errors and issues. Common problems include incorrect arguments, non-numeric data or empty cells, and mismatched array sizes.
To troubleshoot errors and issues with the SUMX2PY2 function in Excel, users should carefully check their formulas before applying the function and handle non-numeric data and empty cells appropriately using the IFERROR function or other techniques.
=SUMX2PY2({10, 20}, {5, 15, 25})
This formula would result in an error due to the mismatched array sizes. To correct this issue, the user should ensure that both arrays have the same number of data points.
Best Practices for Ensuring Accurate and Reliable Results with Excel’s SUMX2PY2 Function
To ensure accurate and reliable results when using Excel’s SUMX2PY2 function, users should follow several best practices. These include:
- Checking formulas for accuracy and completeness before applying the function.
- Handling non-numeric data and empty cells appropriately using the IFERROR function or other techniques.
- Applying filters and criteria to focus on specific subsets of data.
- Using conditional formatting or visual aids to identify patterns and outliers in your data.
By following these best practices, users can maximize the accuracy and reliability of their data analysis and make more informed decisions based on their results.
Analyzing Data with Pivot Tables and Charts using Excel’s SUMX2PY2 Function
Excel’s SUMX2PY2 function can be used in conjunction with pivot tables and charts for more advanced data analysis. By creating a pivot table or chart based on their data, users can quickly and easily compare datasets and identify trends and patterns over time.
For example, if you were comparing the sales figures for two different products using the SUMX2PY2 function, you could create a pivot table that summarizes your data by product and time period. This would enable you to quickly identify areas where one product is outperforming the other and pinpoint the factors contributing to these differences.
Harnessing the Power of Excel’s SUMX2PY2 Function for Enhanced Data Analysis
Excel’s SUMX2PY2 function is a powerful tool for enhanced data analysis that can be used to compare datasets, identify trends and patterns, and make informed decisions based on your results. By following best practices and utilizing advanced techniques such as conditional formatting and pivot tables, users can maximize the power of this function and unlock insights in their data.
=SUMX2PY2({10, 20, 30}, {5, 15, 25})
This formula would give you a result of 2700, which can be used to compare the sales figures for two different products and identify areas where one is outperforming the other.
Mastering the SUMX2PY2 Function: An Expert’s Guide to Excel Data Analysis
Mastering Excel’s SUMX2PY2 function requires a deep understanding of its syntax, arguments, and applications. By familiarizing themselves with the function and its best practices, users can become experts in Excel data analysis and unlock the full potential of their datasets.
Expert users of the SUMX2PY2 function may also explore more advanced techniques such as array formulas and dynamic arrays to further enhance their data analysis capabilities and automate their workflows.
